Lesson 4
How Does “I Think” Become a Testable Hypothesis?
Build an inspectable hypothesis from a subject, trigger, observation period, outcome, comparison, and a condition that would not support the claim.
During lunch, Hoppy walked past a HopPop Cola shop.
A long queue stretched outside. The staff looked as if they were racing the drinking straws.
Hoppy took a photo and wrote in his research notebook:
HopPop Cola is so popular. Its stock may rise later.
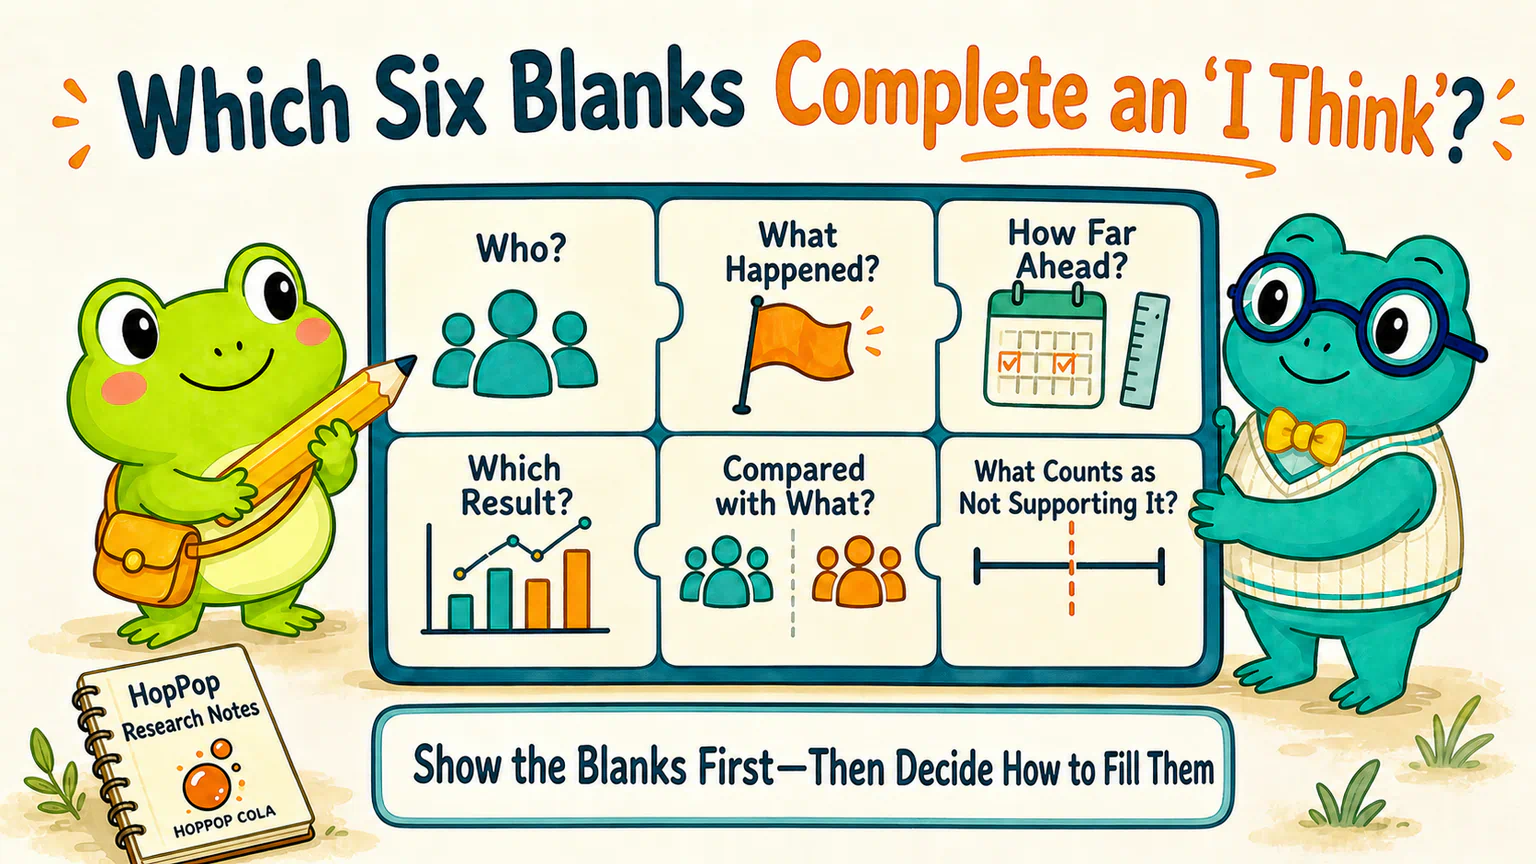
Dr. Hop looked at the sentence and brought out six blank notes:
Who are we studying?
What happened?
How far ahead will we look?
Which result will we read?
What will we compare it with?
What counts as not supporting it?
“Haven't we seen these questions before?” Hoppy asked.
“We have,” said Dr. Hop. “They appeared in the trend and reversal lessons. Today we are not repeating the argument. We are collecting them into one reusable tool.”
Blank One: Who?
Are we studying HopPop Cola alone or a group of beverage companies?
Are we looking across the whole A-share market or only one type of stock?
Change the research subjects, and we change the question.
The first blank tells us where to look for observations later.
Blank Two: What Happened?
Hoppy said that HopPop Cola was “popular.”
What does that mean?
- queues appeared outside shops;
- sales grew;
- online searches increased;
- discussion on social platforms suddenly jumped.
Each may relate to popularity, but they are not the same event.
We will not choose for Hoppy in this lesson.
For now, we simply expose the blank: the study needs a trigger condition that can be identified.
Blank Three: How Far Ahead?
“The stock may rise later” could mean the next 5 trading days, the next 20 trading days, or the next year.
Different periods may describe different patterns.
This blank fixes the observation window.
Blank Four: Which Result?
What will we read at the end?
Will we only ask whether the ending price is above the starting price, or calculate the return over the whole period? Do cash dividends count?
This is the outcome measure.
We do not need a formula yet, but we must know which number we plan to read.
Blank Five: Compared with What?
Suppose HopPop Cola rises 6%.
If most stocks rise 12% over the same period, HopPop has lagged the market.
If the market falls 4%, the same 6% looks very different.
The comparison might be other stocks, peer companies, or a market index. The question should determine the choice.
“Which result?” and “Compared with what?” are different blanks. We should not squeeze them into the vague phrase “performed well.”
Blank Six: What Counts as Not Supporting It?
The last blank sets a boundary in advance.
For example:
If stocks meeting the condition do not perform better than the comparison,
the current result does not support the original claim.
This is not a complete statistical rule.
It simply tells us which outcomes cannot be turned into “I was right after all.”
Join the Six Blanks into One Sentence
Now connect the six notes:
Within 【the research universe】, after a company meets the pre-defined 【trigger condition】, is its 【outcome measure】 over the next 【observation period】 better than 【the comparison】? If 【the not-supporting condition】 occurs, we will say the current result does not support the original claim.
The sentence still contains brackets.
That is normal.
The brackets do not mean the research has failed. They show us which definitions are still missing.
Seeing the gaps is safer than letting AI quietly decide what “popular,” “later,” and “performed well” mean for us.
When you meet a new market intuition, ask six things: who, what happened, how far ahead, which result, compared with what, and what counts as not supporting it.
Put New Explanations into the Next Round
New ideas are allowed to appear during research.
Hoppy may begin with 5 trading days and later decide that 20 trading days is also worth studying.
That is fine. Write it as the next hypothesis instead of pretending the first question always used 20 days.
One line is enough:
Keep the original record. Give the new idea a new round.
The trend and reversal lessons have already shown why this matters, so we will not repeat the full explanation here.
Next: How Does the Real World Become Data?
Hoppy placed the six notes in his research notebook:
Who? __________
What happened? __________
How far ahead? __________
Which result? __________
Compared with what? __________
What counts as not supporting it? __________
The hypothesis now had a skeleton.
But the second blank was still empty. Should queues, sales growth, or online searches represent “HopPop Cola is popular”?
The same problem appears elsewhere. Does a “large” company mean more employees, higher revenue, or greater market capitalization? How should we record that a price is “strong”?
The next lesson asks how ordinary ideas from the real world become numbers we can place in a table.
This course uses A-share stocks and trading days as its main practical setting. Exact calendars, benchmarks, rules, and available data differ across markets, but the six-blank tool does not depend on one particular exchange.
References
Sources checked on August 14, 2026
- The six-blank hypothesis card is an internal teaching tool created for this course and does not rely on an external source.
HopPop Cola, its shop queue, and the research hypothesis are fictional teaching examples. They do not refer to a real company or security. Nothing in this lesson is investment advice.
Lesson discussion
Share a question, insight, or different view—and see how other learners are thinking.