Lesson 2
Not Everything Important Fits Neatly into a Spreadsheet
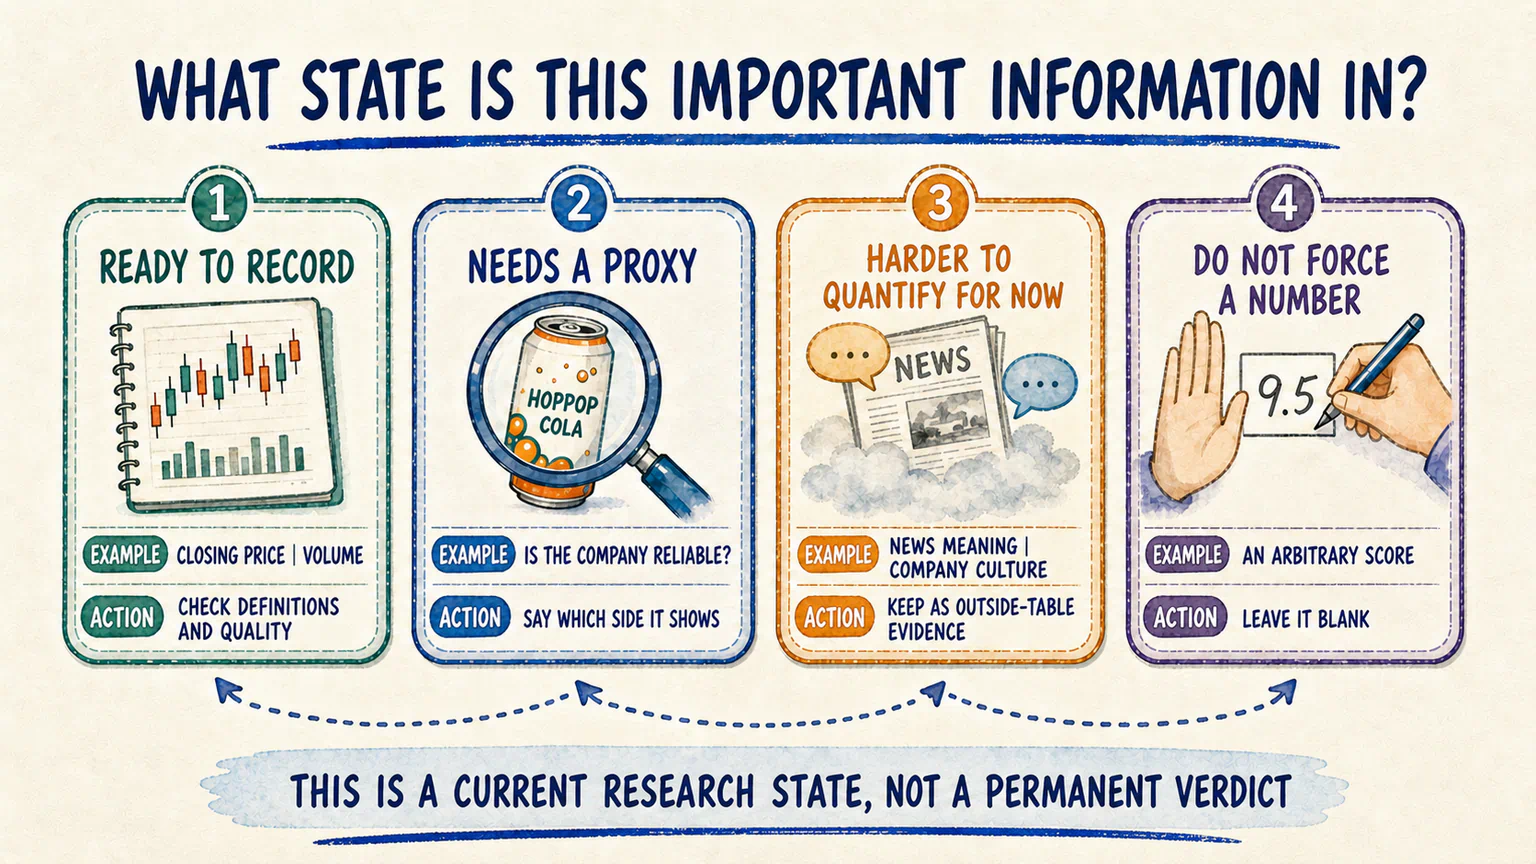
Separate direct records, proxies, currently difficult measurements, and numbers that should not be forced—and notice what the table leaves outside its frame.
Hoppy reopened the spreadsheet from the previous lesson.
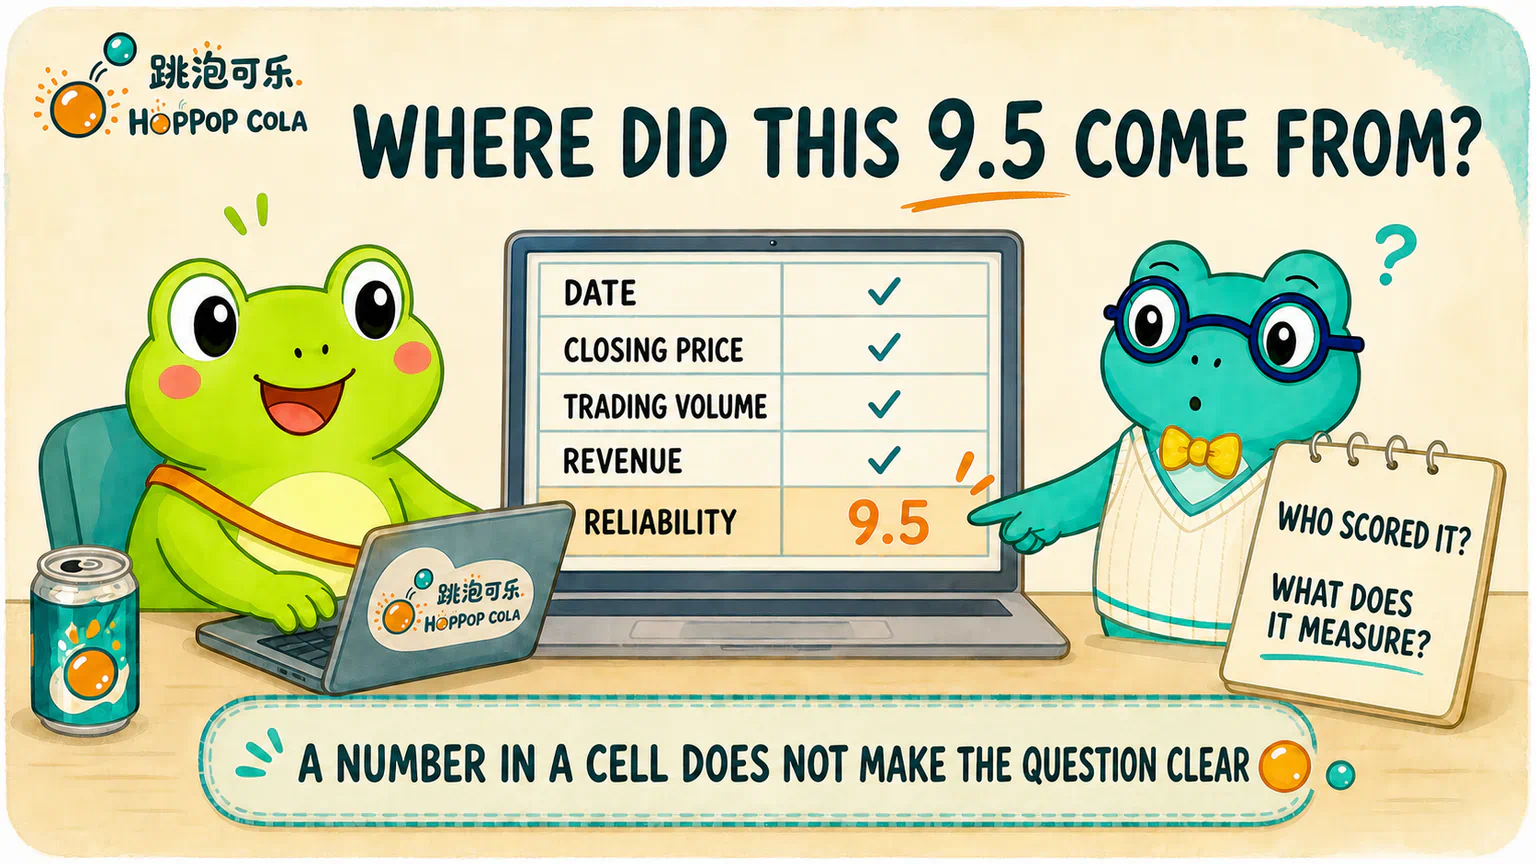
The date, closing price, and trading volume were easy enough to enter. He could also add the revenue that HopPop Cola had disclosed.
Then he reached the next row:
How reliable is this company?
Hoppy thought for a moment and typed a number beside it:
9.5
Dr. Hop saw the number. He did not say that it was too high or too low.
He only asked, “Out of how many?”
“Ten.”
“Who gave the score?”
“I did.”
“And does 9.5 mean that HopPop delivers on time, rarely has product problems, or simply makes cola you enjoy?”
Hoppy moved the cursor back over the cell. The number suddenly looked rather lonely.
It was certainly inside the spreadsheet.
But no one knew what it meant once it got there.
Reality Does Not Arrive as a Finished Spreadsheet
Prices, volume, and dates look naturally data-like.
They usually come with reasonably clear recording conventions. We can ask for the closing price on a particular date or count how many shares changed hands that day.
Yet many things we actually care about look quite different:
- Is the company well managed?
- Do customers genuinely like the brand?
- Does the industry have room to grow?
- What did a news story really change?
- Has the market become too excited?
These questions are not less important than a closing price. They simply do not arrive wearing number-shaped name tags, ready to line up inside a table.
So let us not divide the world too quickly into two permanent piles: “quantifiable” and “not quantifiable.”
A more useful question is: What state is this information in right now?
First: It Already Has a Reasonably Clear Record
Examples include HopPop Cola's closing price and trading volume on a particular trading day, or revenue reported by the company.
These records already have relatively clear names, dates, and conventions. Software can read them more easily, and we can compare them more consistently.
But “easy to put in a table” does not mean “free of problems.”
A closing price does not tell us why people traded. One revenue figure does not tell us whether the company sold more only because it cut prices. Even standardized data still requires checks for timing, definitions, units, omissions, and errors.
It is easier to record. It is not an automatic answer.
Second: There Is No Ready-Made Number, but We Can Look for a Proxy
Hoppy really wanted to know whether HopPop Cola was reliable.
That question was too broad for one cell. But he could first ask which side of “reliable” he actually meant.
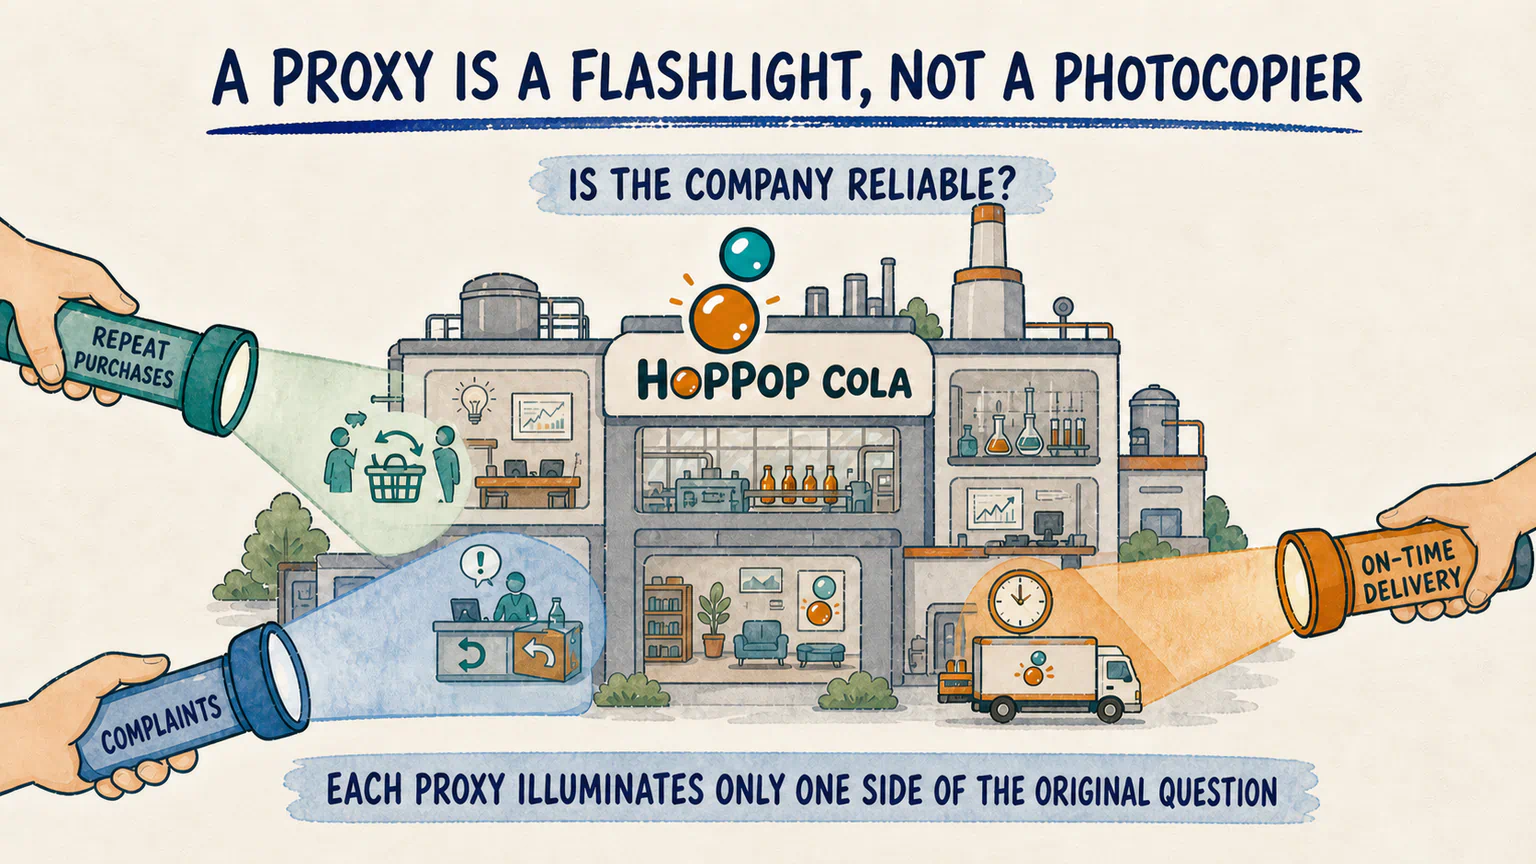
If he cared about whether customers returned to buy again, he might examine repeat purchases.
If he cared about recurring product problems, he might examine complaints and returns.
If he cared about whether the company could keep supermarket shelves supplied, he might examine delivery delays.
None of these records is reliability itself. Each helps us approach one side of it.
This is commonly called using a proxy measure, or simply a proxy: when the thing we care about is difficult to observe directly, we temporarily use something related and recordable in its place.
Proxies are useful. Without them, many questions about the real world could never be examined.
Proxies are also risky. The moment a researcher chooses one, the researcher has already chosen which side of reality to look at.
A Proxy Is a Flashlight, Not a Photocopier
During a power outage, a flashlight can illuminate a bottle of cola on a table.
But lighting the bottle cap does not illuminate the whole table.
A proxy works the same way.
A high repeat-purchase rate may mean customers like the product. It may also mean that a generous coupon brought them back.
Few complaints may mean that the product is dependable. It may also mean that customers cannot find the complaint form—or cannot be bothered to use it.
On-time delivery tells us something about one part of the supply chain. It does not tell us that management is equally strong in strategy, research, or finance.
Before using a proxy, ask at least three questions:
If we cannot answer those questions, there is no need to rush into calculation.
The biggest problem with Hoppy's 9.5 was not a missing decimal place. It was that no one knew where the flashlight was pointing.
Third: It Is Difficult to Quantify with Our Current Setup
Some information is not impossible to study. It simply requires much more than a daily price table.
Consider the meaning of a news story.
We could try to record when the story appeared, which companies it mentioned, whether its language sounded positive or negative, and perhaps train a model to classify many articles.
New problems would immediately appear:
- The same sentence may mean different things in different contexts.
- The publication time may not be when the market first learned the information.
- Positive wording does not necessarily mean better-than-expected news.
- A model-generated score still needs evidence that it measures what we think it measures.
Management ability, company culture, and brand perception present similar difficulties. They are not forever beyond research. They may require more evidence, more complicated definitions, and additional validation.
This first version of the course does not quantify news text or geopolitical information. That is not because these things are unimportant. We are beginning on ground where a beginner can complete the full research process: structured daily A-share stock and index data.
Stating that boundary is more professional than pretending we can measure everything.
This course uses China's A-share market as its first shared data setting. Other markets differ in reporting standards, available fields, trading rules, and data access. The lesson here still travels: every dataset records some parts of reality and leaves others outside the table.
Fourth: We Should Not Force It into a Number Yet
Sometimes the problem is not that our technology is too weak. We simply have not decided what we are trying to measure.
“HopPop Cola has soul, so I give it 9.5” is one example.
If the score has no clear meaning, no trustworthy record, and no defensible relationship to the research question, turning a feeling into a number does not make it scientific.
Some data may also be too costly to obtain, come from unreliable sources, or require private information that should not be collected. In those cases, an empty cell is more honest than a precise-looking invention.
“We should not quantify this yet” does not mean that the subject can never be studied.
It means that, given the current question, data, and methods, we have not found a recording approach we can trust.
Outside the Spreadsheet Does Not Mean Forgotten
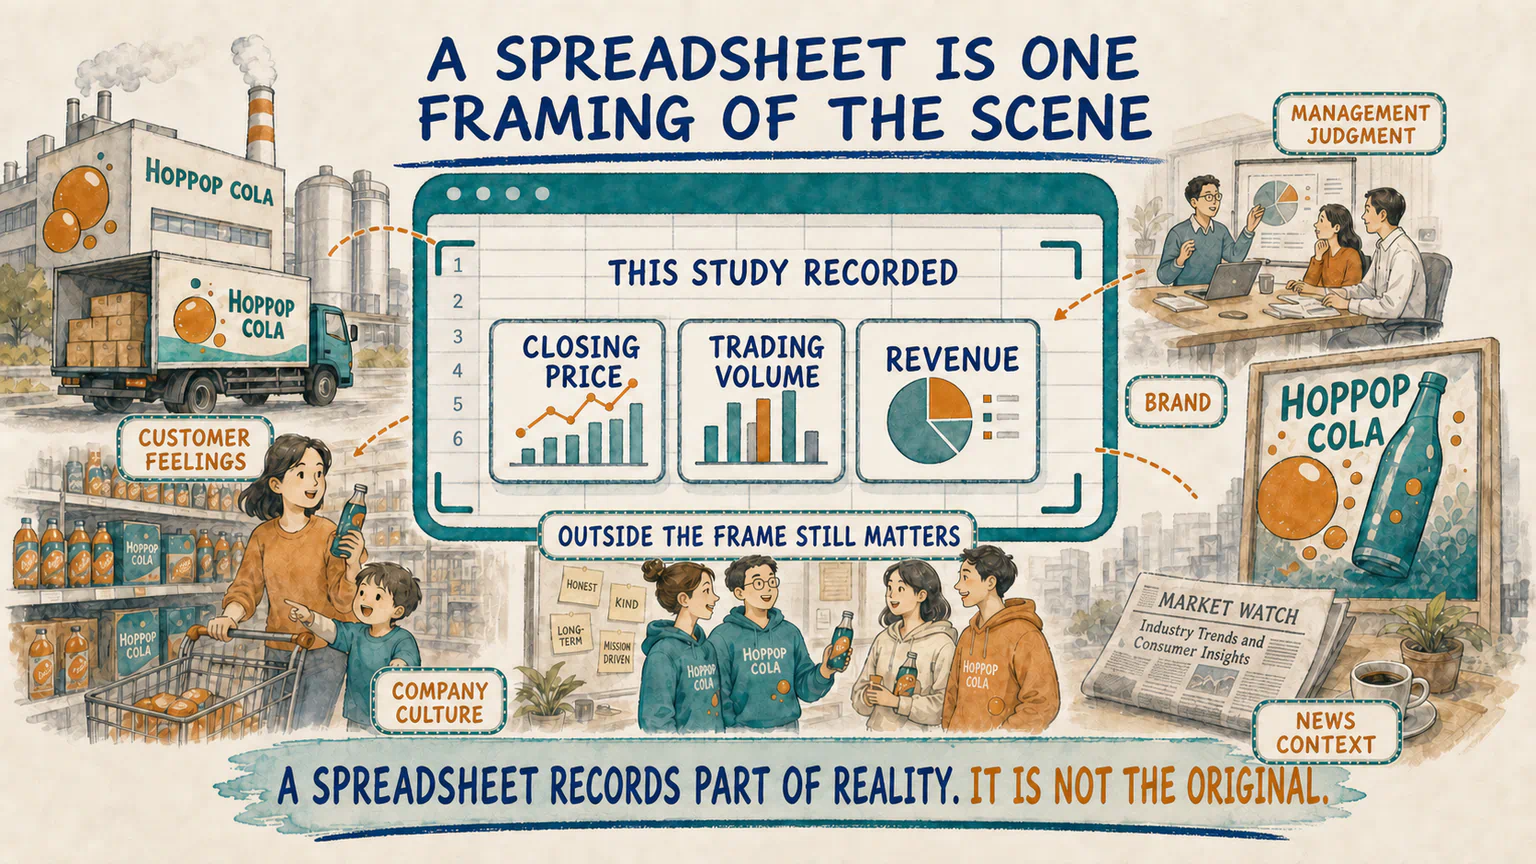
Suppose Hoppy keeps only prices, trading volume, and financial data.
Why HopPop Cola's new flavor suddenly became popular, why management changed its retail channels, and whether company culture affects execution may not enter this calculation.
That information can still do important work:
- suggest the next hypothesis;
- help explain an unusual result;
- reveal what the current data leaves out;
- limit how far we can extend the conclusion.
Quantitative research does not declare everything outside the spreadsheet invalid.
It says something more honest: This round recorded these things. It did not record those things.
A Spreadsheet Is One Framing of the Scene
Different researchers can build entirely different tables around the same company: HopPop Cola.
One may record price and volume. Another may organize revenue and costs. Someone else may study industry sales, news, or customer behavior.
No table automatically becomes the complete HopPop Cola.
Each answers a smaller question. Each leaves something outside its frame.
A spreadsheet is a selected picture, not the original reality.
Being computable does not mean we measured the right thing. Being absent from the table does not mean something is unimportant.
Next: What Do Quants Actually Research?
Hoppy deleted the lonely 9.5.
He did not delete the row asking whether the company was reliable. Instead, he wrote two questions beside it:
What will we use to observe it in this study?
What does that record leave out?
The spreadsheet did not become all-knowing.
It finally became honest.
One question remained. Even when researchers agree to use data, they may choose different tables, different questions, and different kinds of evidence.
So what do quantitative researchers actually study, and why does quantitative research contain so many different-looking approaches?
References
Sources checked on August 13, 2026
- Shanghai Stock Exchange: XBRL Taxonomies supports the point that some company disclosures can be organized through taxonomies into more machine-readable structured information. This lesson does not treat structured data as complete, error-free, or automatically suitable for every research question.
- The OECD Handbook on Constructing Composite Indicators and OECD guidance discussing proxy indicators support the boundaries that indicators simplify complex realities, methodological choices affect results, and proxies require cautious interpretation.
- NIST: Validity supports the basic question of whether a measurement actually measures what the researcher intends to measure.
- NBER: Which News Moves Stock Prices? A Textual Analysis confirms that news text is not impossible in principle to study quantitatively. This lesson does not teach textual analysis or treat the paper's findings as a trading conclusion.
HopPop Cola, its reliability score, repeat purchases, complaints, deliveries, and all operating events are fictional teaching examples. They do not refer to a real company, security, disclosure, or investment opportunity. This lesson explains how to think about recorded and currently unrecorded information. It is not investment advice.
Lesson discussion
Share a question, insight, or different view—and see how other learners are thinking.