Lesson 3
What Do Quants Actually Research?
Recognize common quantitative research routes and separate labels for research subjects, evidence entrances, time scales, and tools.
Hoppy was trying to rename a research file.
It contained daily data for HopPop Cola and a group of A-share companies. He wanted to compare company characteristics and see whether similar patterns had appeared repeatedly in the past.
As soon as he typed “HopPop Cola research,” his computer offered a long list of folders:
Quantitative stock selection
Factor research
Trend following
Event-driven research
Statistical arbitrage
Machine learning
High-frequency trading
Hoppy dragged the file toward “Quantitative stock selection,” then paused. He moved it toward “Factor research” and still did not feel sure.
If he later used a predictive model, would the file need to move again? If he studied price changes around company announcements, should he rename it “Event-driven”?
He finally asked a few researchers.
The first said, “You are comparing many stocks. Of course it is quantitative stock selection.”
The second said, “You are looking for characteristics that can be compared repeatedly. Factor research also fits.”
The third glanced at the data frequency. “Whatever it is, it certainly is not high frequency.”
Oddly enough, all three could be right.
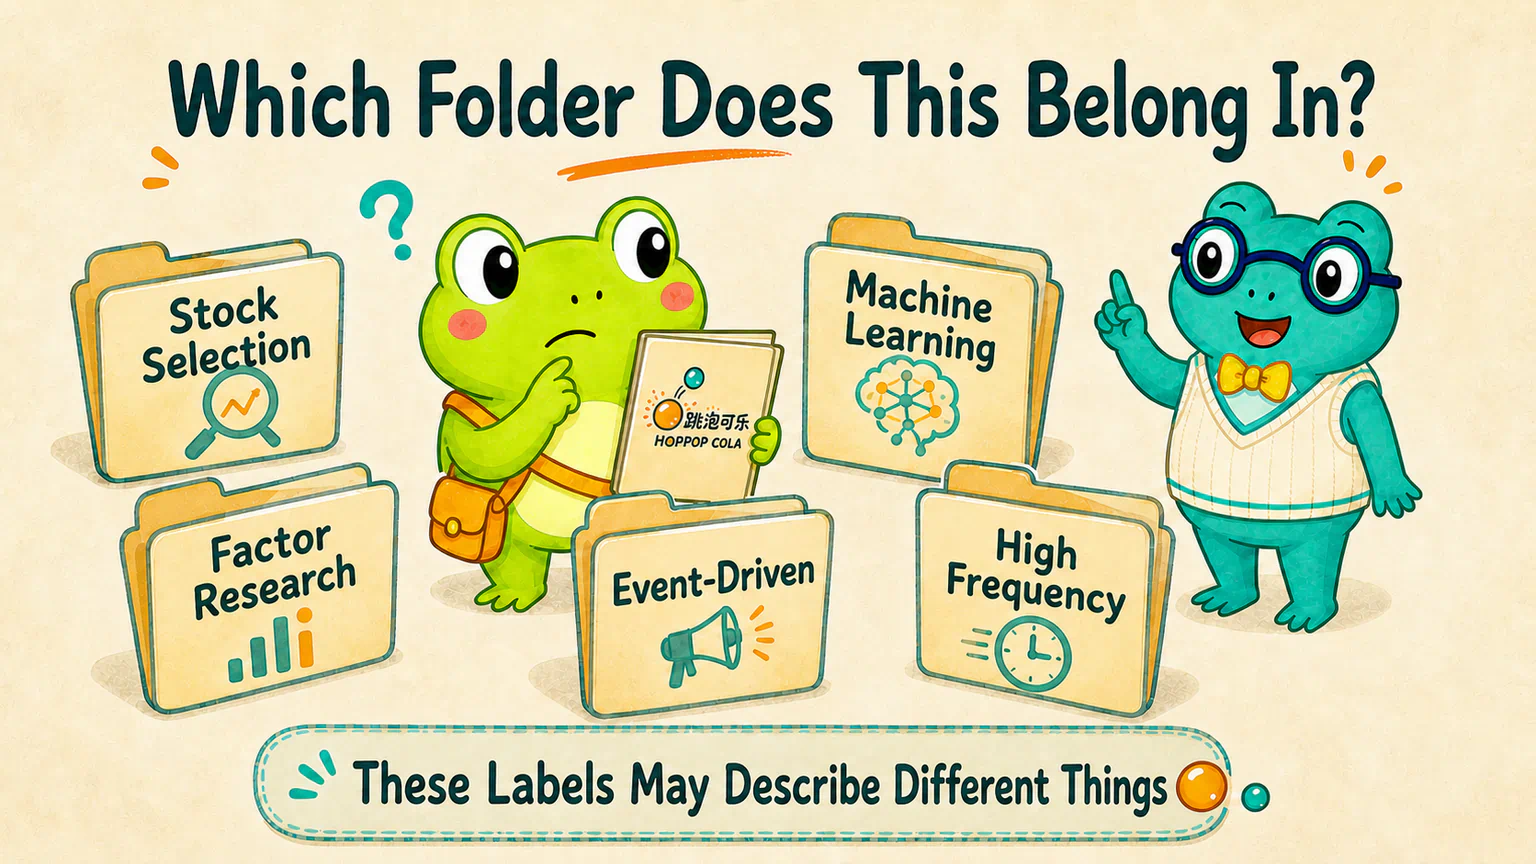
These Labels Are Not Answering the Same Question
Putting “factor,” “high frequency,” “event-driven,” and “machine learning” in one flat list is rather like placing these on the same menu:
noodles
ready in ten minutes
cooked in a frying pan
a little spicy
They all describe the same meal, but they are not the same kind of description.
Quant labels work the same way.
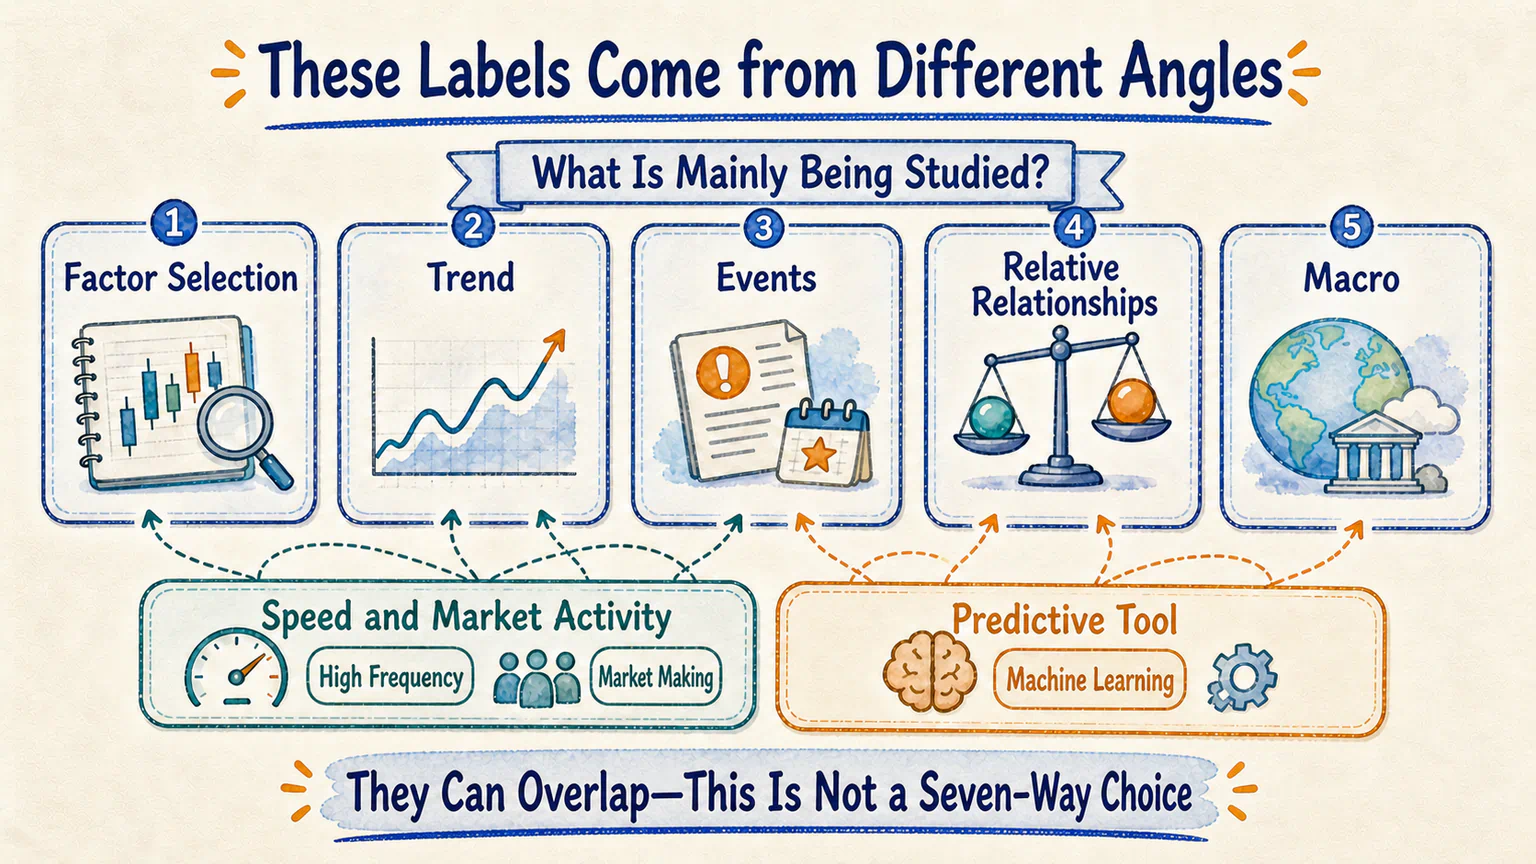
Some labels tell us what the research mainly studies: differences between companies, price trends, a specific event, or the relationship among a group of assets.
Some tell us how the researcher looks for an answer: begin with a possible explanation, begin with a repeating pattern in data, or train a predictive model.
Others describe how fast the trading is or which tool is being used.
So the first rule is simple:
Do not begin by asking which camp a project belongs to. First ask which part of the project the label is describing.
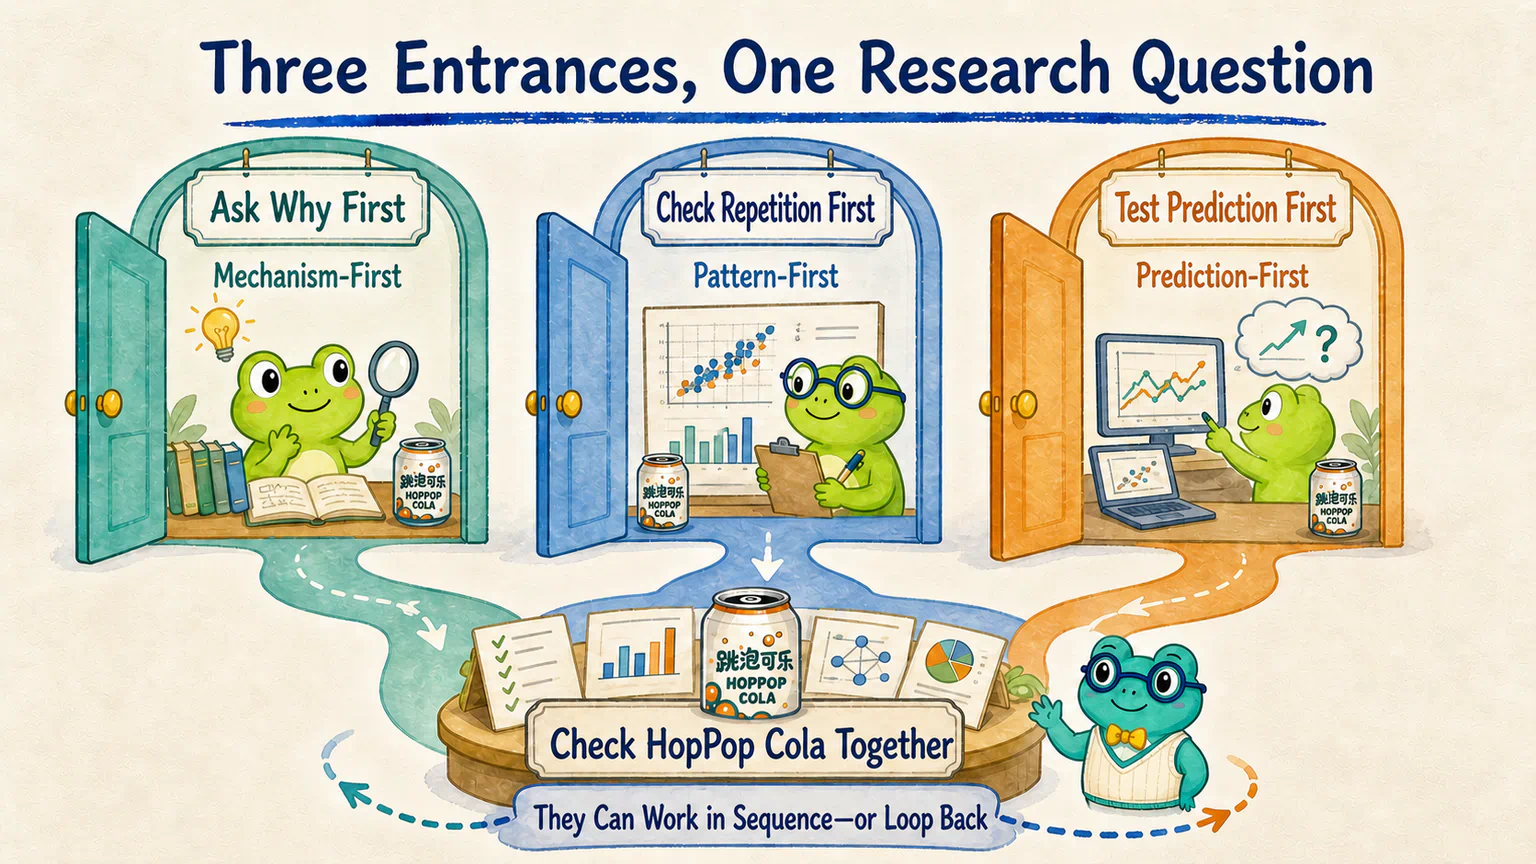
Three Entrances, Not Three Offices That Never Speak
We have already met three ways to begin looking for evidence.
We only need a short reminder here. What matters now is how they enter quantitative research.
Begin with “Why might this happen?”
Some researchers begin with a real-world mechanism.
For example, a researcher might think that growing demand for lower-sugar drinks could change category sales. Sales, prices, and costs could then affect business results, which could eventually affect market expectations.
The researcher first makes that chain clear, then looks for data that can check whether each link holds up.
This is a mechanism-first entrance.
Begin with “Has this happened repeatedly?”
Another researcher may postpone the full story.
They compare many companies and many dates, look for a difference or shape that repeatedly appears alongside a later outcome, and then check whether it survives in another period or another sample.
This is a pattern-first entrance.
Begin with “Can we predict it more accurately?”
A third researcher may combine prices, trading volume, company records, and industry data in a model that estimates future returns, direction, risk, or the probability of an event.
The main question is whether the prediction still helps on new data that did not participate in training the model.
This is a prediction-first entrance.
All three doors can lead into the same room.
A researcher might begin with a business explanation for lower-sugar drinks, use historical comparisons to check whether the difference appears repeatedly, and then ask whether adding more information improves prediction.
Another researcher might discover a pattern first and look for a plausible explanation afterward.
A Common Route: Factors and Quantitative Stock Selection
This kind of research often begins with a long row of stocks. Researchers organize characteristics such as relative valuation, company size, growth, profitability quality, or past price behavior, then compare what happened later to stocks with different characteristics.
In plain language, it is a little like giving many stocks the same health check and asking whether any of the measurements are connected to later outcomes.
“Quantitative stock selection” usually says that the project will compare and select stocks systematically. “Factor research” often says that the researcher is looking for and testing common characteristics that may help explain or distinguish stock performance.
The two labels often appear together. Later, we will separate indicators, candidate factors, and signals more carefully.
The real difficulty is defining each characteristic, comparing fairly, ruling out coincidence, and checking whether costs would consume a small pattern.
Another Route: Trend Following
Trend research mainly watches the direction that prices have already taken. A researcher has to define how long a trend is, what counts as continuation, and what change tells the rule to exit.
Evidence usually comes from repeated checks across many periods and instruments. The difficulty is that prices wobble: a trend may end just as the rule recognizes it, and frequent changes in direction create costs.
We already explored the investment idea behind trend following earlier. Here it simply shows that the same price-based idea can be expressed as a consistent rule that is open to repeated testing.
Another Route: Event-Driven Research
Event-driven research begins by circling something on the calendar: an earnings release, merger announcement, share repurchase, index reconstitution, or a policy change defined in advance. The researcher then observes what happened around the event and compares it with the broad market, its industry, or similar companies.
The easiest mistake is this:
an event happened
=
a trading opportunity exists
Of course it does not.
An event only helps align the observations in time. The market may have known about it already, and the sample may be too small. Researchers still need to define the observation window, the comparison, and the result that would fail to support the original idea.
Another Route: Statistical Arbitrage and Market Neutrality
This kind of research often asks more than “Will one stock rise or fall?” It studies relative relationships between two or more instruments.
Imagine two beverage companies whose prices often moved together in the past. They suddenly separate. A researcher may ask whether the gap is a temporary departure or evidence that the businesses have genuinely become different.
Statistical arbitrage often begins with such statistical relationships and relative pricing. Pairs trading is an easy-to-understand example.
The word “arbitrage” does not make the process risk-free. An old relationship can break, a gap can widen further, and liquidity or costs can change the result.
“Market-neutral” usually means trying to reduce exposure to some broad market direction; it does not remove the other risks. These approaches also tend to involve opposing positions, hedging, and more complex execution. The practical part of this course does not use short selling, so our only job here is to place this route on the map.
Another Route: Quantitative Macro Research
Quantitative macro research pulls the camera farther back.
It may observe interest rates, inflation, economic growth, currencies, credit, and commodity prices, then study how those changes relate to markets, industries, or indices.
If HopPop Cola depends heavily on sugar, aluminum, and transport, a macro researcher might begin with raw materials, interest rates, and consumer conditions rather than the sales of a single bottle.
These questions often connect data with different frequencies across countries and markets. Macroeconomic data may arrive slowly and be revised later, while the same inflation figure can produce very different market reactions in different economic environments.
Two Labels That Are Especially Easy to Put on the Wrong Shelf
The five routes above at least say something about the research subject or the strategy idea.
The next two labels are often placed in the same list of “quant camps,” even though they come from two other angles.
High Frequency and Market Making: One Concerns Speed, the Other an Activity
High-frequency trading generally uses high-speed systems to monitor market data, submit many orders, and establish and close positions over very short intervals. It is not simply a daily-data strategy with a faster computer, because the data, latency, market microstructure, and risk controls all change with it.
Market making describes a different market activity. A market maker stands ready to buy or sell at quoted prices, provides a counterparty for other traders, and manages its own inventory and price risk.
A high-frequency firm may make markets or run statistical-arbitrage strategies. Market-making activity is not the same as all high-frequency trading.
This is a useful example of overlapping labels: trading speed and the market activity being performed are not the same axis.
Machine Learning: More Like a Toolkit and a Predictive Method
Machine learning can handle many inputs, complicated relationships, and a large set of possible models. Quantitative stock selection, event prediction, and macro research can all use it, so the label mainly describes a predictive toolkit rather than the full research subject.
Flexibility creates its own problem: the more easily a model adapts to old data, the more carefully it may learn noise. Researchers need genuinely unseen data for evaluation and must avoid running many experiments only to report the prettiest result.
Accurate prediction and causal explanation are still different achievements. A model may help measure and predict without automatically revealing why the market produced the relationship.
One Project Can Carry Several Labels
Now return to Hoppy's file.
Suppose the project does the following:
- uses A-share daily market data and public company records;
- organizes value, growth, and price-trend characteristics for many stocks;
- compares whether those characteristics distinguish later outcomes;
- then combines several inputs with a machine-learning model and performs an out-of-sample prediction check.
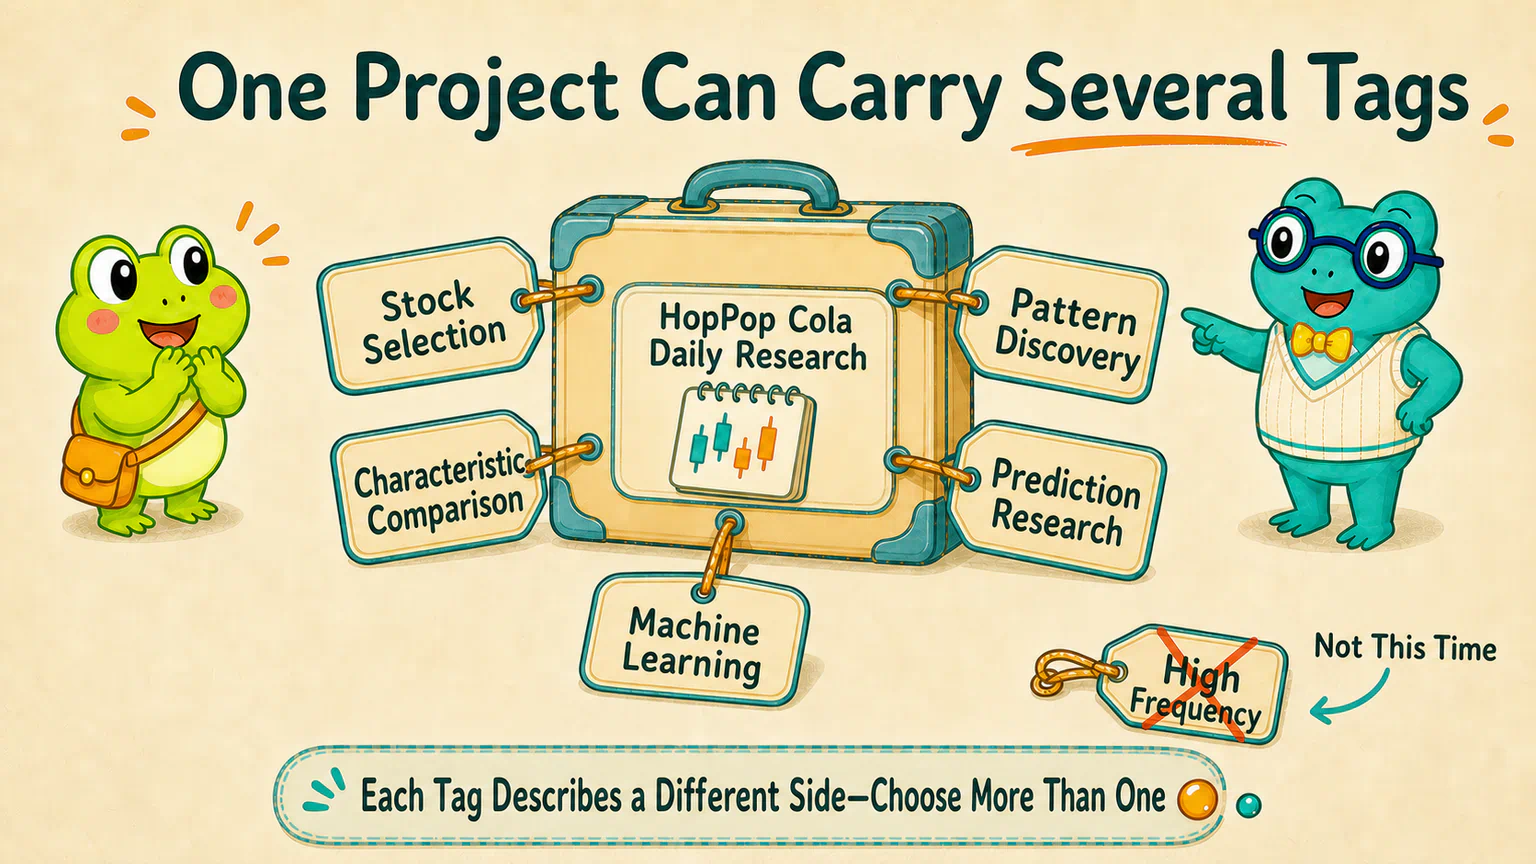
The same project can reasonably be called:
- quantitative stock selection, because it compares stocks systematically;
- factor-style research, because it studies a set of repeatedly comparable characteristics;
- pattern-first research, because it checks whether historical differences recur;
- prediction research, because it estimates a future outcome;
- a machine-learning project, because it uses that predictive tool;
- daily-frequency research, because it has one set of market records per day.
It is not high-frequency trading. Using a computer does not send one-row-per-day data into the world of microseconds.
If Hoppy later focuses only on the periods around earnings releases, the project will gain an “event-driven” label too.
Labels are not identity cards that force us to choose only one.
They are more like several luggage tags attached to the same suitcase: one says what is inside, another says where it is going, and another says how it will travel.
When You Meet a New Term, Ask Three Questions
The quant world contains many labels that this lesson has not listed.
You do not need to memorize a new set of camps every time you meet one.
Start with three questions:
What does it mainly observe?
How does it find and check evidence?
Is the label describing the research question, the speed, or the tool?
If you want to continue, add one more:
Which data, knowledge, trading conditions, or infrastructure does it depend on most?
That keeps “high frequency” from becoming an advanced version of daily research, “machine learning” from becoming a market law, and “market-neutral” from becoming “risk-free.”
A Label Is Not a Leaderboard
High frequency sounds fast. Machine learning sounds new. Arbitrage sounds like guaranteed money.
Each term arrives with its own glow.
Yet reliability still returns to the specific research: Are the definitions clear? Can the data be trusted? Is the comparison fair? Were costs omitted? Does the result survive another period?
A complex model can make mistakes very carefully. A simple rule can repeat its mistakes very consistently.
Labels are luggage tags for a research project. They are not mutually exclusive identity cards, and they are certainly not a performance leaderboard.
Hoppy stopped trying to force the file into one folder.
He renamed it:
HopPop Cola research
Question: compare stock characteristics with later outcomes
Evidence: historical comparisons + prediction checks
Time scale: daily
Tool: not decided yet
The name was a little longer, but anyone opening the file could now see what the project was actually doing.
Next: How Can an ‘I Think’ Statement Be Tested?
The map of quantitative research routes is now open before us.
Of course, a beginner does not need to learn factors, high frequency, arbitrage, macro, and machine learning all at once. Our practical work will use A-share daily data and begin with one market idea that can be stated clearly and checked step by step.
But we do not need the complete practical route yet.
Whatever tools we eventually choose, every study must first answer a simpler question: what is an ordinary sentence beginning with “I think” still missing before the data knows how to challenge it?
That is where the next lesson begins.
HopPop Cola remains fictional, and this course uses A-share daily stock and index data as its main practical setting. Short-selling rules, market-making arrangements, trading mechanisms, data access, and infrastructure differ across markets. Those differences matter in a real implementation, but they do not change the central idea here: research subjects, evidence methods, time scales, and tools are different kinds of labels.
References
Sources checked on August 13, 2026
- CFA Institute: Active Equity Investing: Strategies, used to check the broad positioning and pitfalls of factor-based equity research, statistical arbitrage, event-driven strategies, and quantitative research processes. This lesson does not treat that classification as the only industry standard.
- Tobias J. Moskowitz, Yao Hua Ooi, and Lasse Heje Pedersen: Time Series Momentum, used to check that trend research can systematically study past price direction and later changes. Its historical returns are not used here as a promise about the future.
- A. Craig MacKinlay: Event Studies in Economics and Finance, used to check the basic role of an event study in examining changes in firm value around a defined event.
- Evan Gatev, William N. Goetzmann, and K. Geert Rouwenhorst: Pairs Trading, used to check that statistical-arbitrage research can begin with relative price relationships among related securities. This lesson does not teach the trading structure or borrow the paper's results.
- SEC: Market Centers—Buying and Selling Stock and CFTC and SEC: Findings Regarding the Market Events of May 6, 2010, used to check the basic activity of market making, common high-frequency characteristics, and the fact that high frequency, market making, and statistical arbitrage can overlap without being synonyms.
- Shihao Gu, Bryan Kelly, and Dacheng Xiu: Empirical Asset Pricing via Machine Learning, used to check the role of high-dimensional statistical prediction, the need to guard against overfitting, and the boundary that predictive measurements do not by themselves identify economic mechanisms.
HopPop Cola, the research file, company records, announcements, and every proposed study in this lesson are fictional teaching examples. They do not refer to a real company, stock, or strategy. This lesson explains common quantitative research routes and the limits of their labels; it does not rank returns and is not investment advice.
Lesson discussion
Share a question, insight, or different view—and see how other learners are thinking.