Lesson 5
How Does the Real World Become Data?
Move from a real-world concept through a proxy and variable to a data field while preserving what the definition leaves out.
Hoppy opened his AI research assistant and typed one sentence:
Find companies that are larger than HopPop Cola.
The AI quickly replied:
By “larger,” do you mean more employees, more revenue, more assets, or a higher market value?
Hoppy paused.
“Isn't a big company simply a big company?”
Dr. Hop brought over four boxes and labeled them:
more people
more sales
more resources
the market says it is worth more
“Every box can hold numbers,” said Dr. Hop. “But they may not hold the same companies.”
The previous lesson established that a spreadsheet can illuminate only part of reality. This time, we will not reopen the question of whether everything should be quantified. We will focus on the next step: how an ordinary concept actually becomes data.
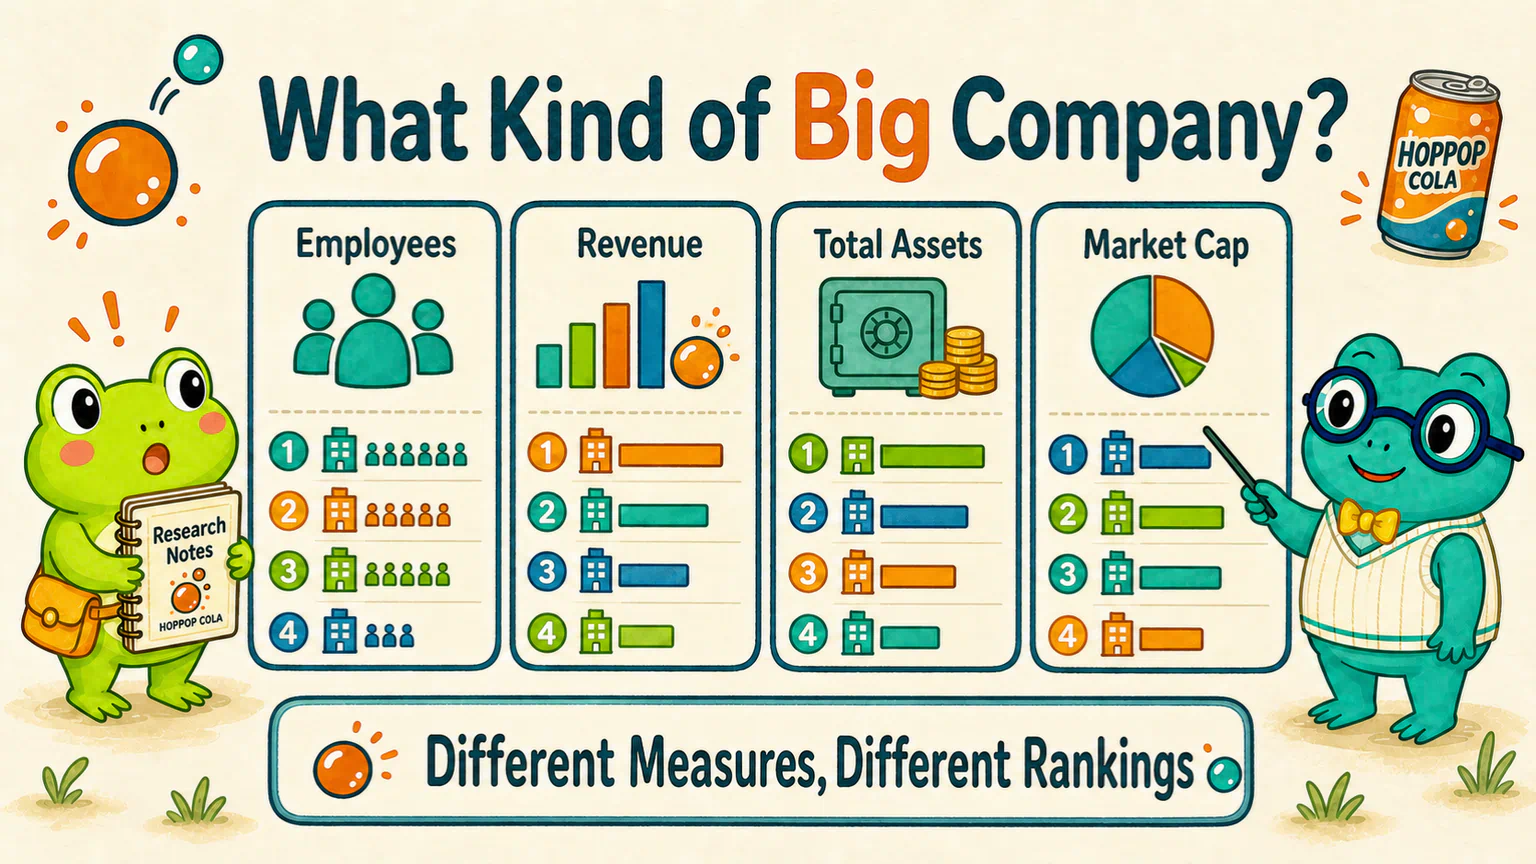
“Company Size” Is Not a Ready-Made Data Field
Employee count describes the size of an organization.
Revenue describes how much a business sold over a period.
Total assets describe the resources recorded on its balance sheet.
Market capitalization describes the total value that the market places on all of a company's shares at a particular time.
Each can describe one side of company size. None is born as the single correct answer to “How large is this company?”
If Hoppy wants to study “large in the market's eyes,” market capitalization may fit.
If he wants to study “how large is the business it does,” revenue may be closer.
If he wants to study “company quality,” none of these four numbers can answer the question by itself.
The measurement choice is not a minor technical detail to handle after downloading the data.
Choose a number, and you have already chosen which side of reality you plan to see.
Step One: Keep the Ordinary Sentence
“Company size,” “industry popularity,” and “price strength” are real-world concepts.
They are useful because this is how people actually think and speak. The trouble is that they are usually not ready for calculation.
We do not need to sneer at these phrases or delete them immediately.
Keep the original words first. Otherwise, we may later forget what the number was supposed to answer.
Hoppy wrote:
Original question: Is the company's size in the market's eyes related to how its stock performs later?
The sentence is not fully precise, but it is already clearer than “Are big companies good?”
Step Two: Say What Will Represent It
“Size in the market's eyes” still does not come with a ruler that plugs directly into a computer.
Hoppy decides to represent it with the company's market capitalization on a particular trading day. We met this move in the previous lesson: choosing an observable record to stand in for a concept that cannot be observed directly is choosing a proxy definition.
We do not need to re-explain why a proxy illuminates only one side. We only need to state this choice clearly: market capitalization represents the size of the equity value that the stock market assigns to the company. It does not automatically tell us:
- how many people the company employs;
- how many assets it owns;
- whether its products sell well;
- whether its management is reliable;
- whether its stock will rise later.
It is the angle this study has chosen, not the only possible answer to “company size.”
Step Three: Let the Number Vary Across Companies and Time
Hoppy now wants to record the market capitalization of different companies on different trading days.
HopPop Cola has one value; other companies have their own. The number may also change from one trading day to the next.
Something that can take different values across subjects or over time can be called a variable.
In this example, a company's market capitalization on a particular trading day is a variable.
A variable is not one cell in a table.
It is closer to the thing we have decided to keep observing. Only after we attach it to one company and one date do we get a particular value.
Step Four: Give the Record a Clear Place to Live
Now the data table can finally enter the story.
company_id | trade_date | market_cap | unit
-----------|------------|------------|-------------
HOPPOP     | one date   | 5000000    | 10,000 yuan
market_cap is the data field used to store market capitalization.
Think of a field as a column with a fixed job: one column stores the company, another stores the date, and another stores market capitalization.
But 5000000 alone still tells us almost nothing.
We also need to know:
- which company it belongs to;
- which date it describes;
- whether the unit is yuan, ten thousand yuan, or something else;
- which market-cap definition was used;
- whether that value was actually available at the time.
A field name is only the label on a drawer. The subject, time, unit, and definition tell us what is inside.
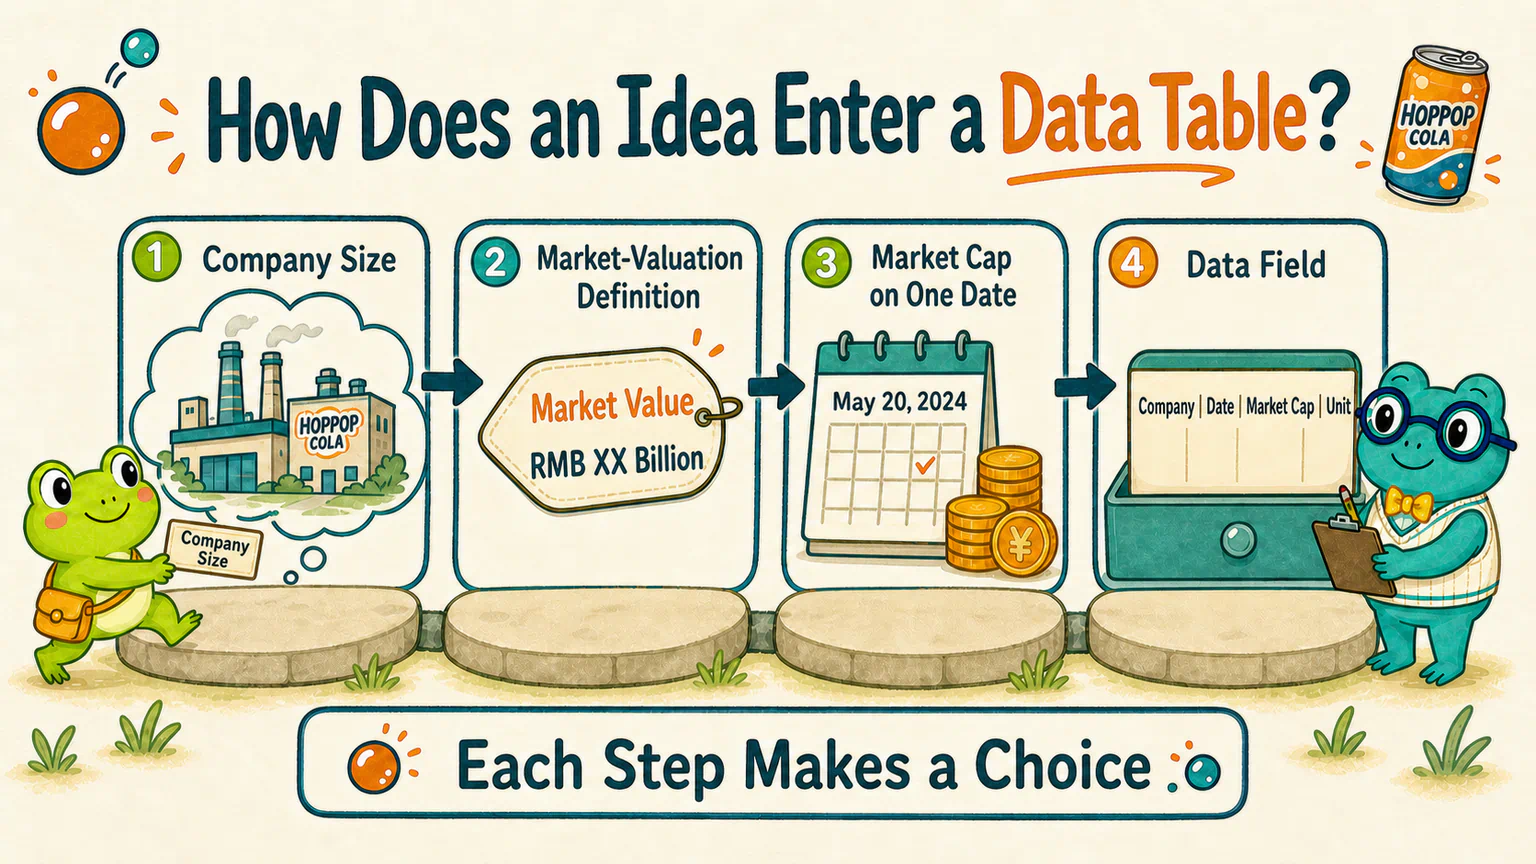
Completing the Four Steps Does Not Produce the Only Answer
The route we just followed was:
Real-world concept: company size
→ Proxy definition: observe the valuation scale recognized by the market
→ Variable: one company's market capitalization on one trading day
→ Data field: market_cap
This chain is clear, but it is not unique.
Another researcher could reasonably begin with revenue if the question truly concerns sales scale—and if the reporting period, currency, and accounting definition are made clear.
Two researchers using different definitions do not automatically make one of them wrong.
The real check is: Does this definition still answer the original question?
Some Numbers Are Easy to Calculate but Answer Almost Nothing
Hoppy thought of an even easier method:
Use the number of characters in a company's name to represent company quality.
That would certainly be easy to calculate.
A program could count the characters almost instantly. A four-character name gets 4 points; an eight-character name gets 8.
But “easy to calculate” does not answer the important question: why should name length represent company quality?
If that bridge has never been built, more decimal places and tidier charts only help us calculate something irrelevant with great care.
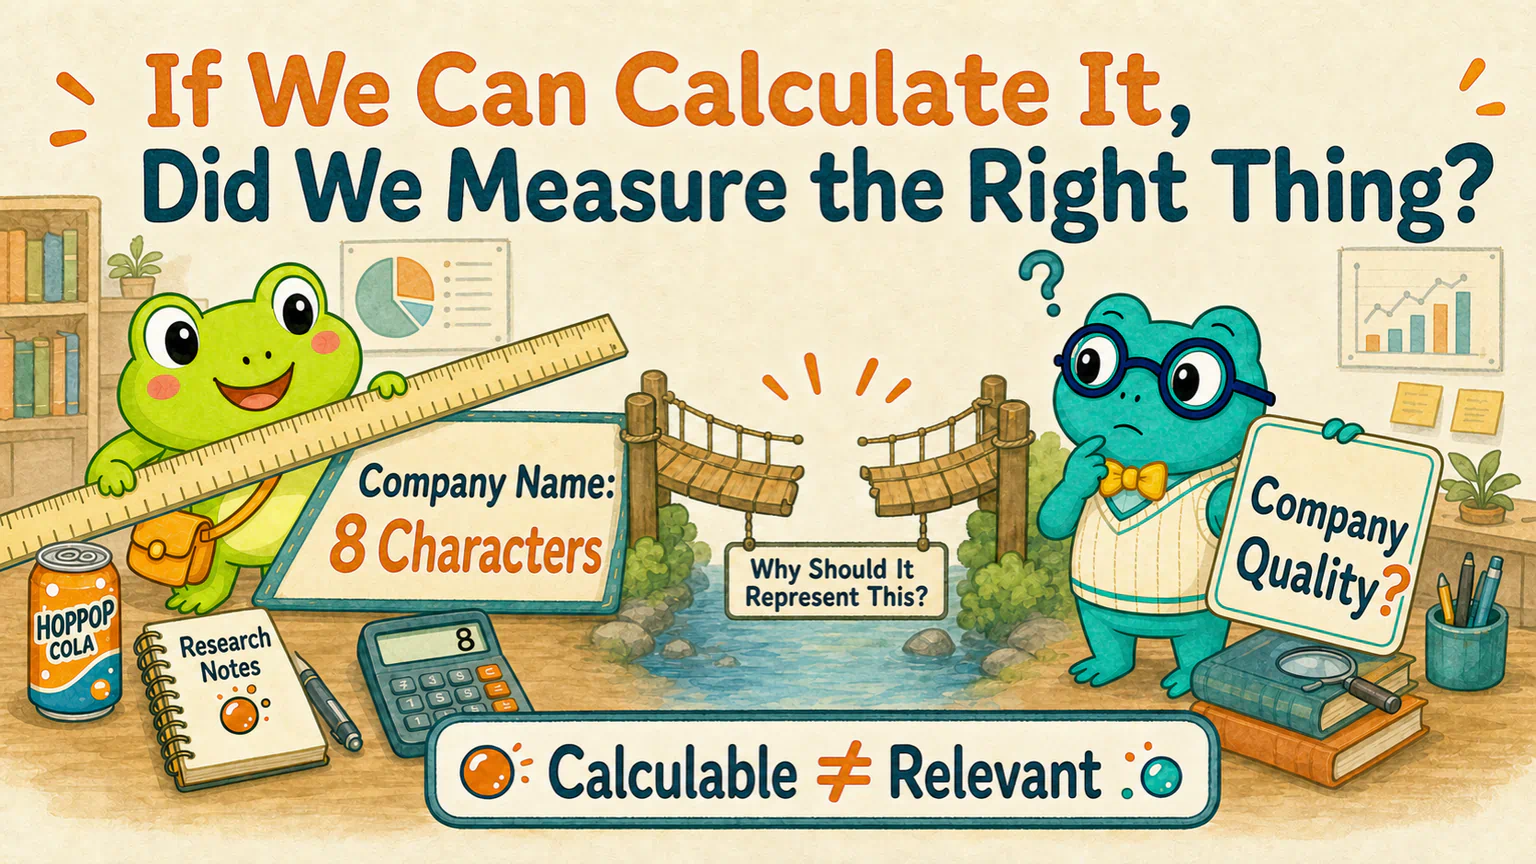
“Can be calculated” only tells us the operation is possible.
Whether it represents the original question requires a separate explanation and check.
Five Questions for Landing a Concept in Data
When you want to place an ordinary idea into a table, begin with five questions:
- What real-world concept did I originally want to study? 2. Which observable thing will I use to represent it? 3. Across whom, or over what time, can this record change? 4. Which field and unit will store it in the table? 5. Which parts of the original question does this definition leave out?
If the second question never receives a convincing answer, this can be a valid conclusion:
With our current question and data, we have not found a reasonable quantitative definition.
Leaving the field empty is not always worse than forcing in a number.
AI can suggest ten possible measures of “company size.” It can also help Hoppy locate fields, convert units, and organize the table.
But Hoppy must still confirm which definition continues to represent the original question.
Next: What Do Indicators Actually Measure?
Hoppy now knows how daily closing price, trading volume, and market capitalization can become data fields.
Researchers often process those records further.
For example, take the closing prices from the past 20 trading days and calculate their average. That processed number is commonly called an indicator.
Open a market chart, however, and moving averages, MACD, RSI, Bollinger Bands, and turnover rate may all appear at once—like a drawer full of differently shaped rulers.
What does each one take as input? What does it measure? What does it leave out?
That is what we will unpack next.
This course uses A-share stocks and trading-day data as its main practical setting. Monetary units and field definitions vary across data providers, and other markets have different rules and available data. The concept-to-field method in this lesson does not depend on one particular exchange or vendor.
References
Sources checked on August 14, 2026
- The five-question concept-to-data card is an internal teaching tool created for this course and does not rely on an external source.
HopPop Cola, its company code, and every table entry in this lesson are fictional teaching examples. They do not refer to a real company or security. Nothing in this lesson is investment advice.
Lesson discussion
Share a question, insight, or different view—and see how other learners are thinking.