Lesson 7
An Indicator Lit Up. Can I Buy Now?
Connect variables, indicators, candidate factors, candidate signals, rules, minimum strategies, and backtests while keeping each stage's role and boundary clear.
Hoppy had closed most of the indicators. All that remained on the fictional HopPop Cola chart was the daily closing price and a 20-day moving average.
The screen finally looked calm.
Then price moved from below the average to above it.
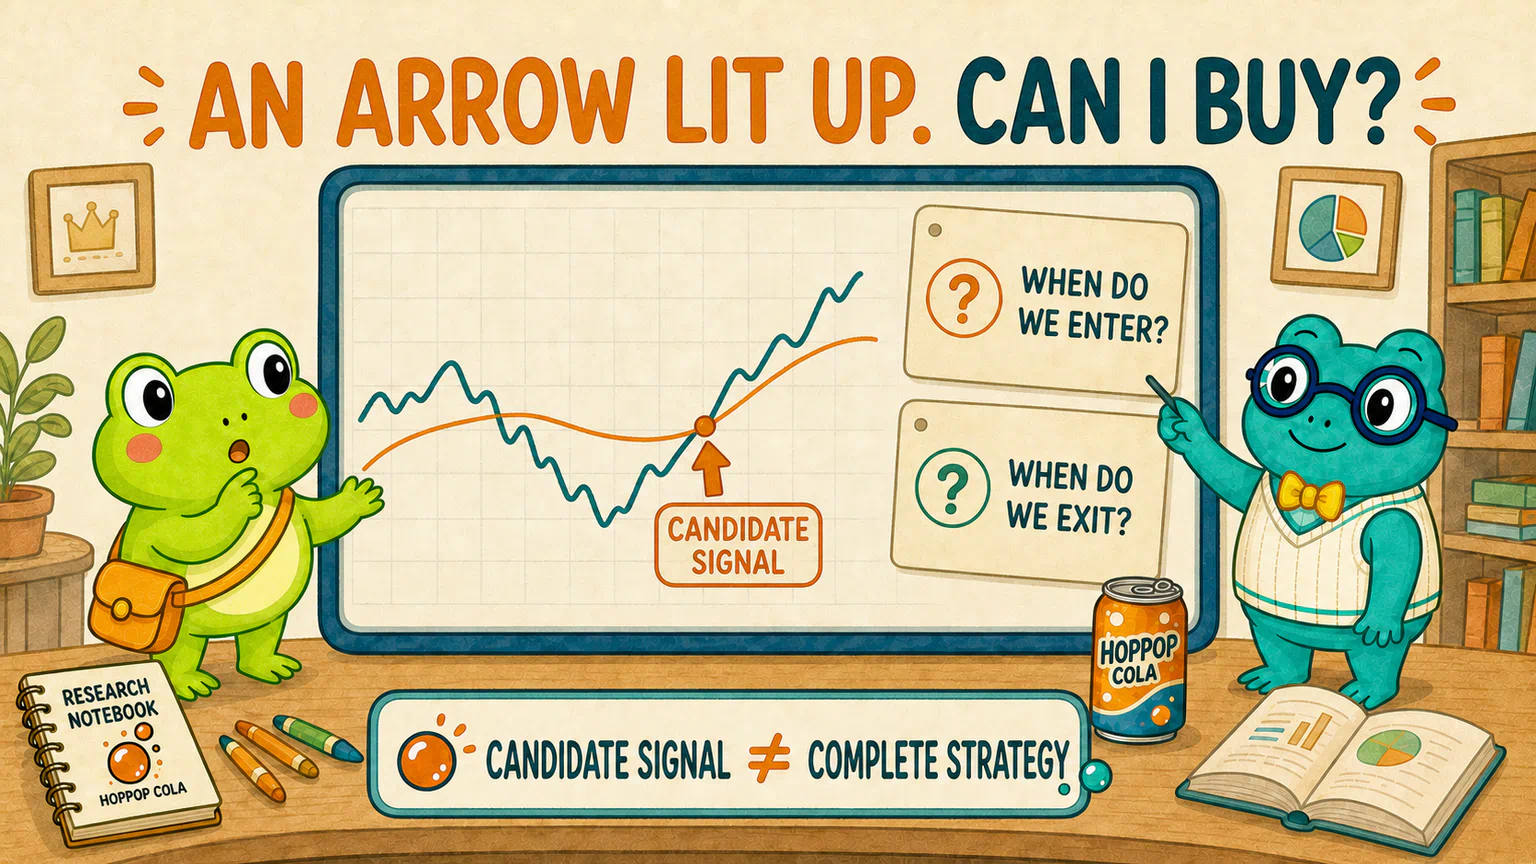
The chart displayed an upward arrow:
Price crossed above the 20-day moving average
Hoppy moved his pointer towards the Buy button.
Dr. Hop asked, “When are you planning to buy?”
“Now.”
“Is ‘now’ before the market closes or after it closes?”
Hoppy paused.
Dr. Hop had one more question. “And when will you sell?”
Hoppy slowly moved the pointer away.
The arrow had looked like an answer.
Two ordinary questions were enough to reveal the holes in it.
Do Not Buy Yet—we Are Still in the Middle of the Research Chain
In the previous lesson, we said that an indicator processes records that already exist.
Calculating a 20-day moving average means the program has successfully made a ruler.
Detecting a crossover means we have also defined an event that can be checked on a particular date.
But “the ruler exists,” “the event happened,” “the event is worth trading,” and “we have a strategy” are not four ways of saying the same thing.
We will not add another indicator in this lesson.
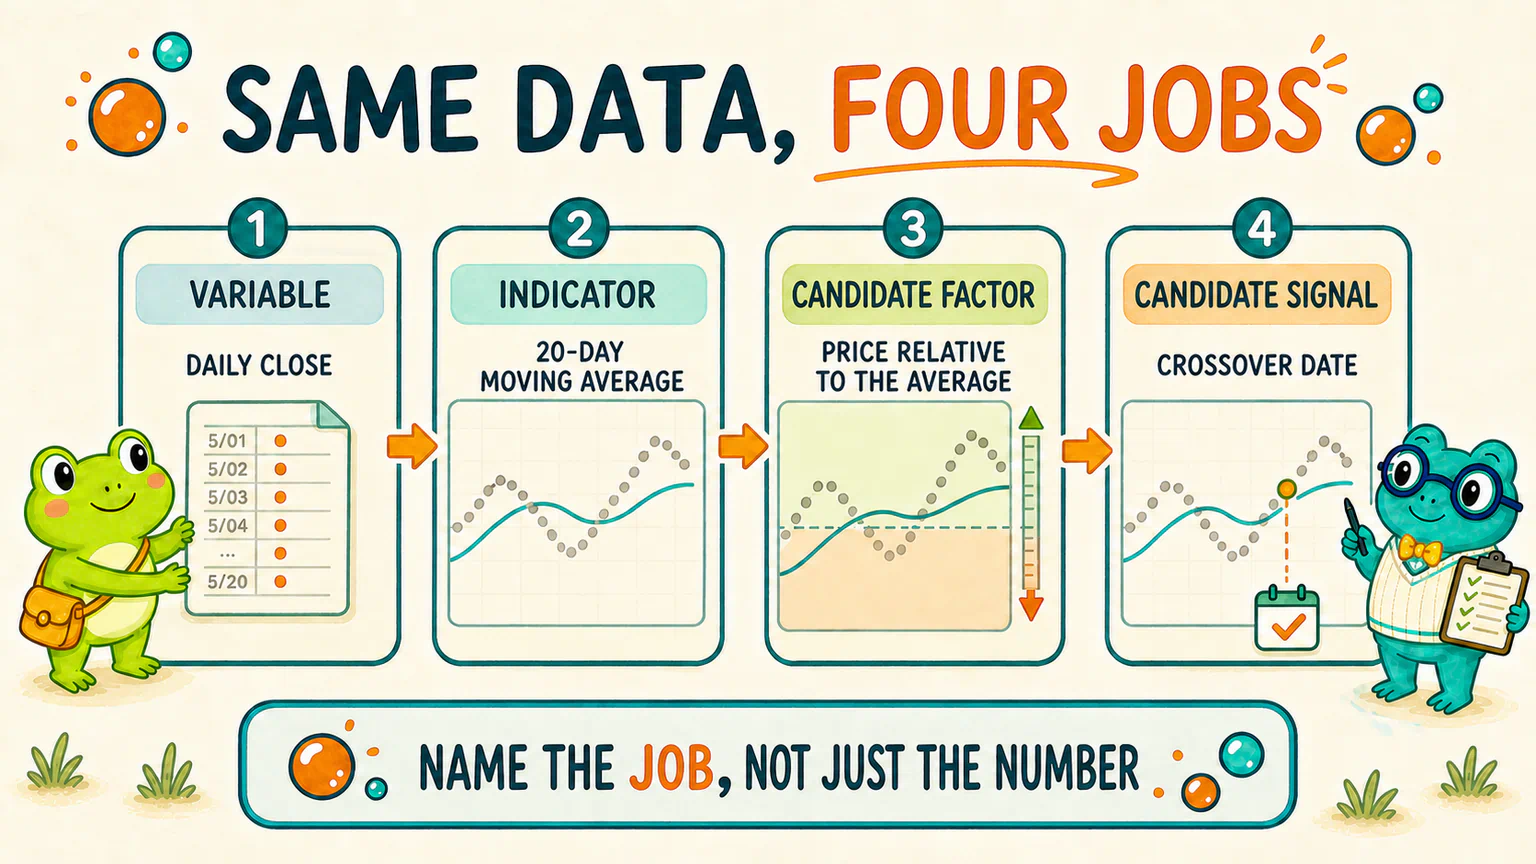
We will follow this one moving average and separate several names that are often squeezed together.
Closing Price Records What Happened
HopPop Cola has one closing price for each trading day.
That value changes across dates, and it also changes across stocks.
Something that can take different values across research objects or time can be called a variable.
Its job is modest: record one part of what we want to study.
It does not yet say “good,” “bad,” “buy,” or “sell.”
Ten yuan is simply ten yuan.
A Moving Average Organizes Those Records
Average the closing prices from the latest 20 trading days, and we get a 20-day moving average.
That is an indicator.
The 20-day window is only an example for this lesson, not a recommended setting.
The indicator does more processing than the original closing price, but it still describes records that have already entered the calculation.
Calling it a “20-day” average does not grant it knowledge of day 21.
Relative Position Begins to Work as a Candidate Factor
We can now ask another question:
When price is above the moving average, is its later performance different from when price is below it?
To compare the two situations, we need to record where price sits relative to the average.
The simplest version may use only “above” and “below.” Another version could record the distance as a continuous number.
At this point, the measurable characteristic begins to do the job of a candidate factor.
This course uses the following plain-language working definition:
A candidate factor is a measurable characteristic that we plan to use systematically to explain, compare, or predict a research outcome.
The word candidate matters.
It means the characteristic is ready to be tested. It does not mean that the characteristic already works, and it certainly does not mean that it causes price to move.
If we merely draw a 20-day moving average on a screen, it is first an indicator.
When we begin to compare price's position relative to that average with later outcomes, the characteristic takes on the role of a candidate factor in this particular study.
The same number can appear at several stages. Its name depends not only on how it was calculated, but also on the job it performs in the research.
A Crossover Event Marks One Point in Time
Now return to the arrow that caught Hoppy's attention.
We can define “crossed above the moving average” more clearly:
Previous trading day: closing price was no higher than that day's 20-day moving average
Current trading day: closing price is above that day's 20-day moving average
When both conditions are true, we record an event on the current trading day.
That can be called a candidate signal.
Its main job is to answer one question:
Did a clearly defined condition occur at this point in time?
It turns a continuous movement into a date that we can mark on a calendar.
But it is still only a candidate for action.
It has not shown that the date is worth buying, and it has not told us how a trade would work.
One Signal Leaves More Questions Than You Might Expect
Hoppy looked at the arrow again.
“If we are already calling it a signal, why can we not backtest it?”
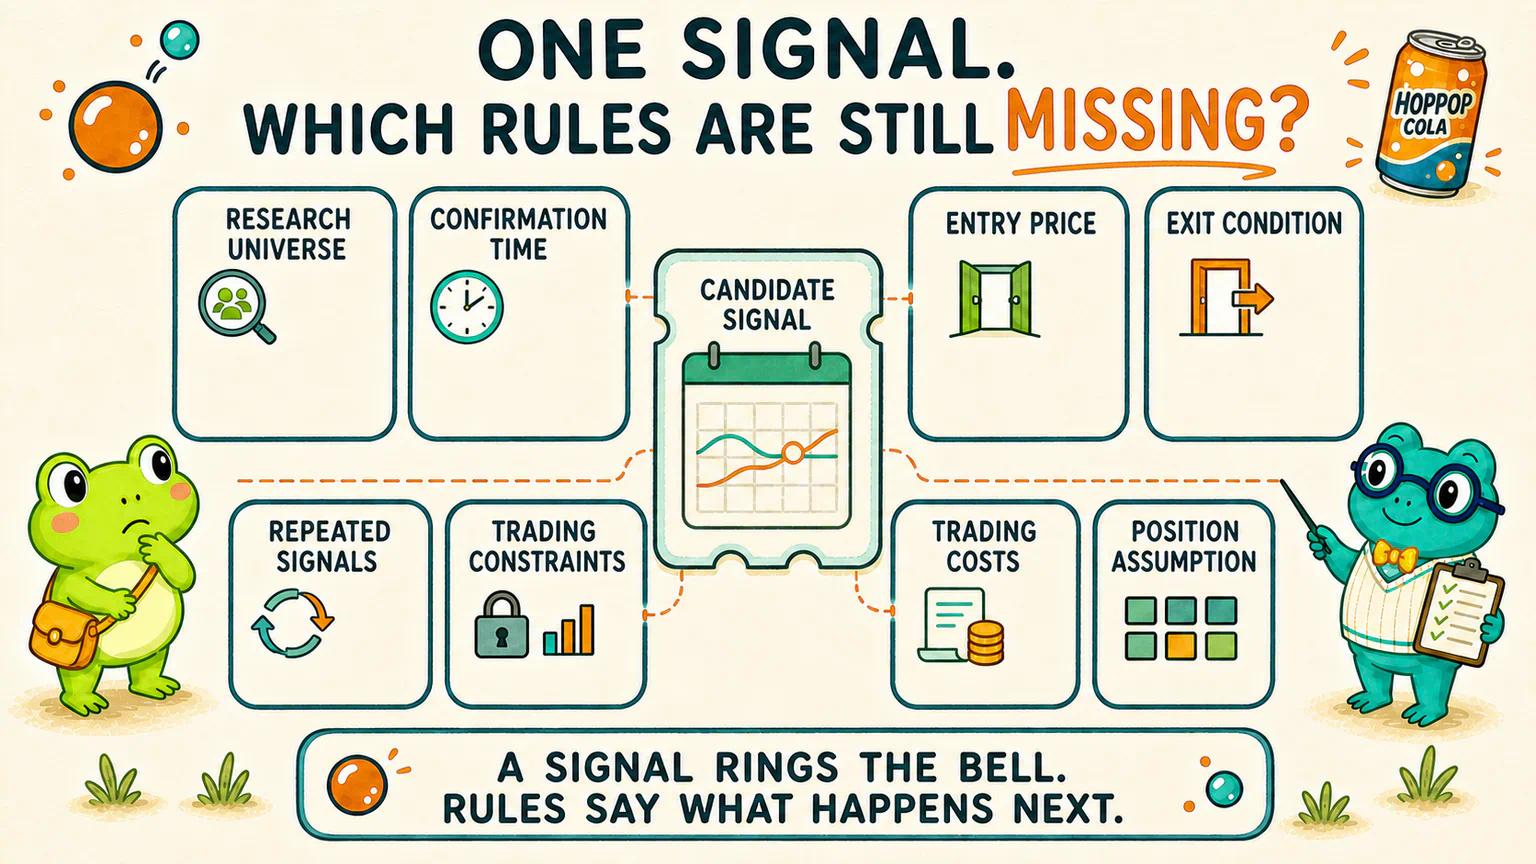
Because an arrow only tells us that something happened here.
It does not tell a program what to do next.
- Which stocks are included? 2. When can we confirm that the signal has appeared? 3. What price can be used for entry? 4. When and under what condition do we exit? 5. How do we handle repeated or overlapping signals? 6. How do we handle suspensions, price-limit restrictions, or missing data? 7. How do we model fees and possible differences in execution price? 8. What consistent position-size assumption do we use for each opportunity?
Leave those blanks empty, and the program must guess.
Every guess can quietly turn the research question into a different version.
Suppose we need today's closing price to confirm the crossover. We cannot then pretend that we knew that closing price in advance and could effortlessly trade at exactly the same price.
What was known at the decision time, when an order could be placed, and whether the historical record represents a feasible fill must remain consistent.
In our A-share examples, a trading suspension or a daily price-limit condition can also separate “we wanted to trade” from “a trade could actually be executed.” Other markets have their own trading hours, order rules, and execution constraints. The research principle is shared; the market details are not identical.
Filling One Blank Gives Us One More Rule
A rule is not mysterious.
It simply states what should happen when a particular situation occurs.
For example, a researcher will eventually need to specify:
- which information confirms the signal;
- the first executable time after the signal appears;
- what ends an observation or holding period;
- one consistent treatment when several opportunities overlap;
- how untradeable cases and data problems are recorded.
We are deliberately not filling in those answers here.
This lesson is not trying to smuggle in a moving-average trading system. Its point is simpler: a signal rings the bell; rules explain what happens after someone hears it.
Consistent Rules Can Form a Minimum Strategy
Once entry, exit, repeated signals, trading restrictions, costs, and position assumptions are all clear, a program can finally follow the instructions from beginning to end.
That executable set of rules can form a minimum strategy.
Here, strategy does not mean a profitable method.
It means the instructions are complete enough for a program to know what to do at each step when it receives the same historical data.
A strategy can be clearly defined and still perform terribly.
There is no contradiction.
Complete rules answer “can this be executed consistently?” They do not answer “will this make money?”
Why Does a Backtest Still Need a Position Assumption?
If we want to combine many historical opportunities into one account-level return series, we must state how much research capital each opportunity receives.
Otherwise, a program cannot calculate how much one price move contributes to the research account as a whole.
Later lessons will therefore use a simple, consistent position assumption.
Its job is to place different rules on the same measuring scale.
That is not the same as teaching you a personal position system suited to your capital, risk tolerance, and real-life needs.
The former is a research condition. The latter is a much broader investment decision. The core course stops at the former.
A Backtest Is a Rehearsal on Recorded History
Only after the rules and minimum strategy are ready can we run a backtest.
A backtest feeds historical data to a program in time order and asks it to simulate:
If we could only see the information available at each historical moment,
and kept following these rules,
what would have happened in the recorded past?
That makes a backtest more like a rehearsal on historical records.
The stage, performers, and weather from that old production have all left traces. We can inspect how the rules behaved in that history.
But the theatre door marked Future remains closed.
A backtest cannot peek through it to see the next performance.
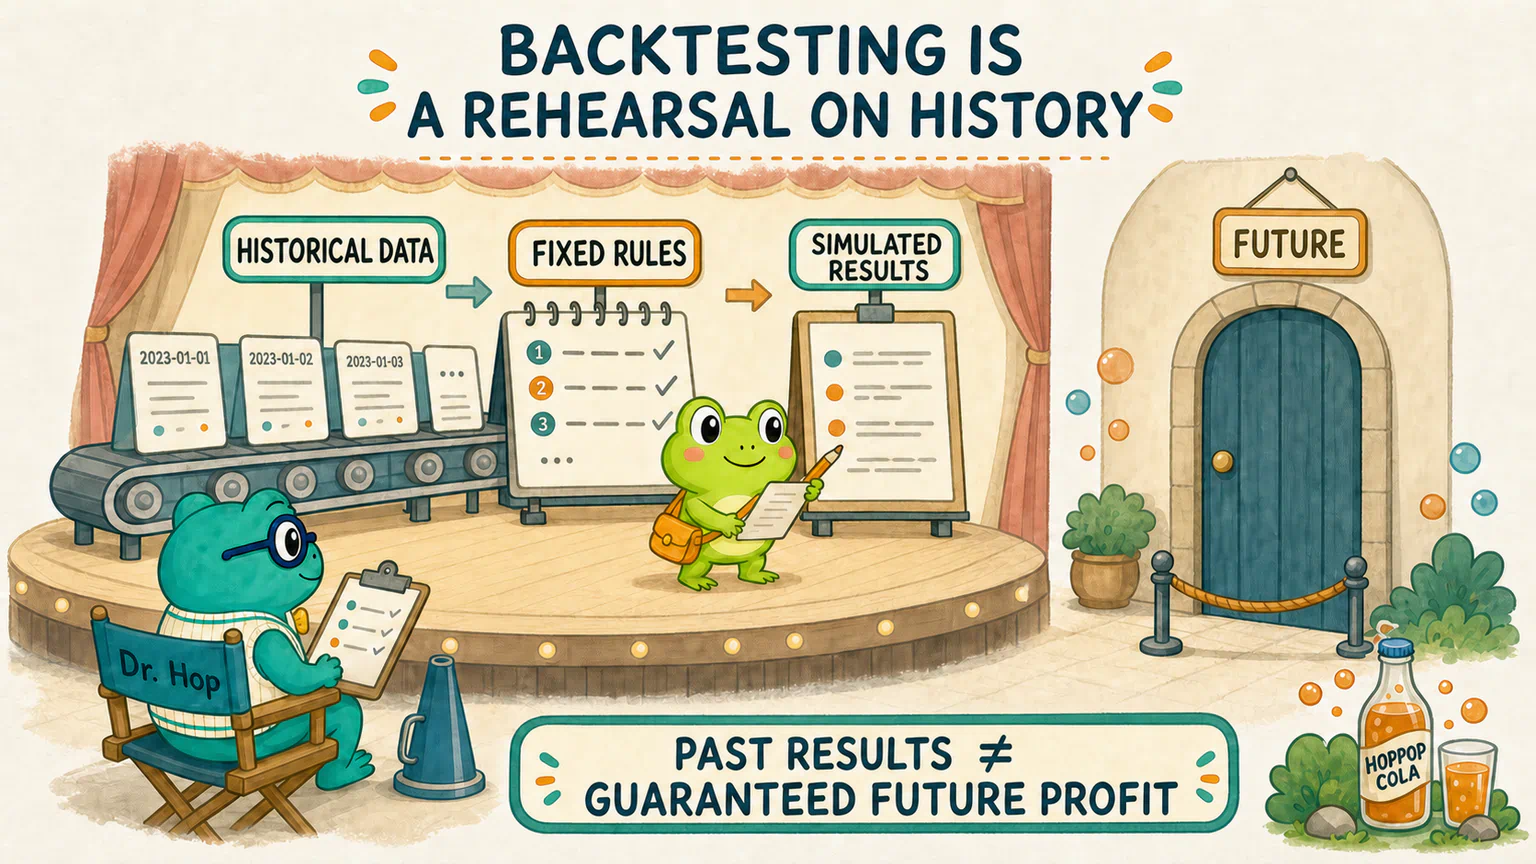
A backtest asks what the current data and rules would have produced in recorded history.
It does not tell us that the strategy will make money in the future.
A Beautiful Result May Be Wearing Research Makeup
A beautiful backtest curve does not necessarily mean that the program lied.
The program may have followed a flawed research design with perfect discipline.
Common problems include:
- Looking ahead: giving the strategy information that was not yet available at the time;
- Keeping only survivors: using stocks that still exist today while omitting historical securities that were delisted or removed;
- Shopping for an answer: repeatedly changing windows, conditions, and parameters, then keeping only the best-looking version;
- Forgetting friction: ignoring fees, slippage, or situations in which an assumed trade could not be executed;
- Mistaking luck for a pattern: finding a historical period that happened to suit the rules, only for the result to disappear elsewhere.
The practical part of the course will inspect these problems one by one.
For now, remember that a successful program run proves only that the program completed a calculation. It does not automatically prove that the research design was sound.
Seven Names, Seven Different Stops
We can now place the terms from this lesson in one line:
| Name | Job in this course |
|---|---|
| Variable | Records something that changes across objects or time, such as daily closing price |
| Indicator | Processes existing records by an explicit method, such as a 20-day moving average |
| Candidate factor | A measurable characteristic waiting for a systematic evidence check, such as price's position relative to its moving average |
| Candidate signal | A candidate for action created when a defined condition occurs at a particular time, such as price crossing above its moving average |
| Rule | States how each situation is handled after a signal appears |
| Minimum strategy | Organizes several rules into instructions that a program can execute completely |
| Backtest | Simulates that strategy on historical data and records what happened in the past |
This table is not the only vocabulary permitted across the financial industry.
It is the working map for the experiments ahead.
Whenever someone says, “This factor gave a buy signal, so the strategy works,” we can pause and ask:
Which stop are they actually talking about?
Which stops in the middle have been skipped?
Next: Assemble the Research Parts into One Route
Hoppy looked at the upward arrow once more.
This time, he did not click Buy.
He wrote one sentence next to it:
A date worth investigating has appeared here.
Dr. Hop nodded.
The arrow had not disappeared. It had simply returned to its proper place.
In the next lesson, we will assemble these research parts into one route and see how the practical half of the course plans to use them.
References
Sources checked on August 14, 2026
- CFA Institute: Active Equity Investing—Strategies, used to check the broad place of an investment thesis, data processing, backtesting, evaluation, risk, and trading costs in a quantitative active-investment process, along with common research pitfalls;
- QuantConnect: Backtesting, used to check the basic definition of a backtest as a historical simulation of a trading algorithm and its past performance;
- QuantConnect: Research Guide, used to check how look-ahead bias, survivorship bias, overfitting, and repeated parameter selection can distort historical results;
- QuantConnect: Trading and Orders, used to check how fees, slippage, and fill models affect the relationship between a backtest and executable trading.
HopPop Cola, every price, moving average, arrow, and trading event in this lesson are fictional teaching examples. They do not refer to a real company, security, return, or strategy. The 20-day moving average exists only to connect the concepts and is not a parameter recommendation. Finance uses factor, signal, and strategy in several ways; this lesson adopts working definitions that remain consistent inside the course. Nothing here is a trading signal, position recommendation, or investment recommendation.
Lesson discussion
Share a question, insight, or different view—and see how other learners are thinking.