Lesson 8
Which Route Will This Course Take?
Assemble the course's hypothesis-driven, interpretable, daily-data empirical route and explain how its two practical cases divide the work.
After the last few lessons, Hoppy's desk was covered with research parts:
Hypotheses
Data definitions
Indicators
Candidate signals
Rules
Backtests
He more or less recognized each part on its own.
But how were they supposed to connect when a real study began?
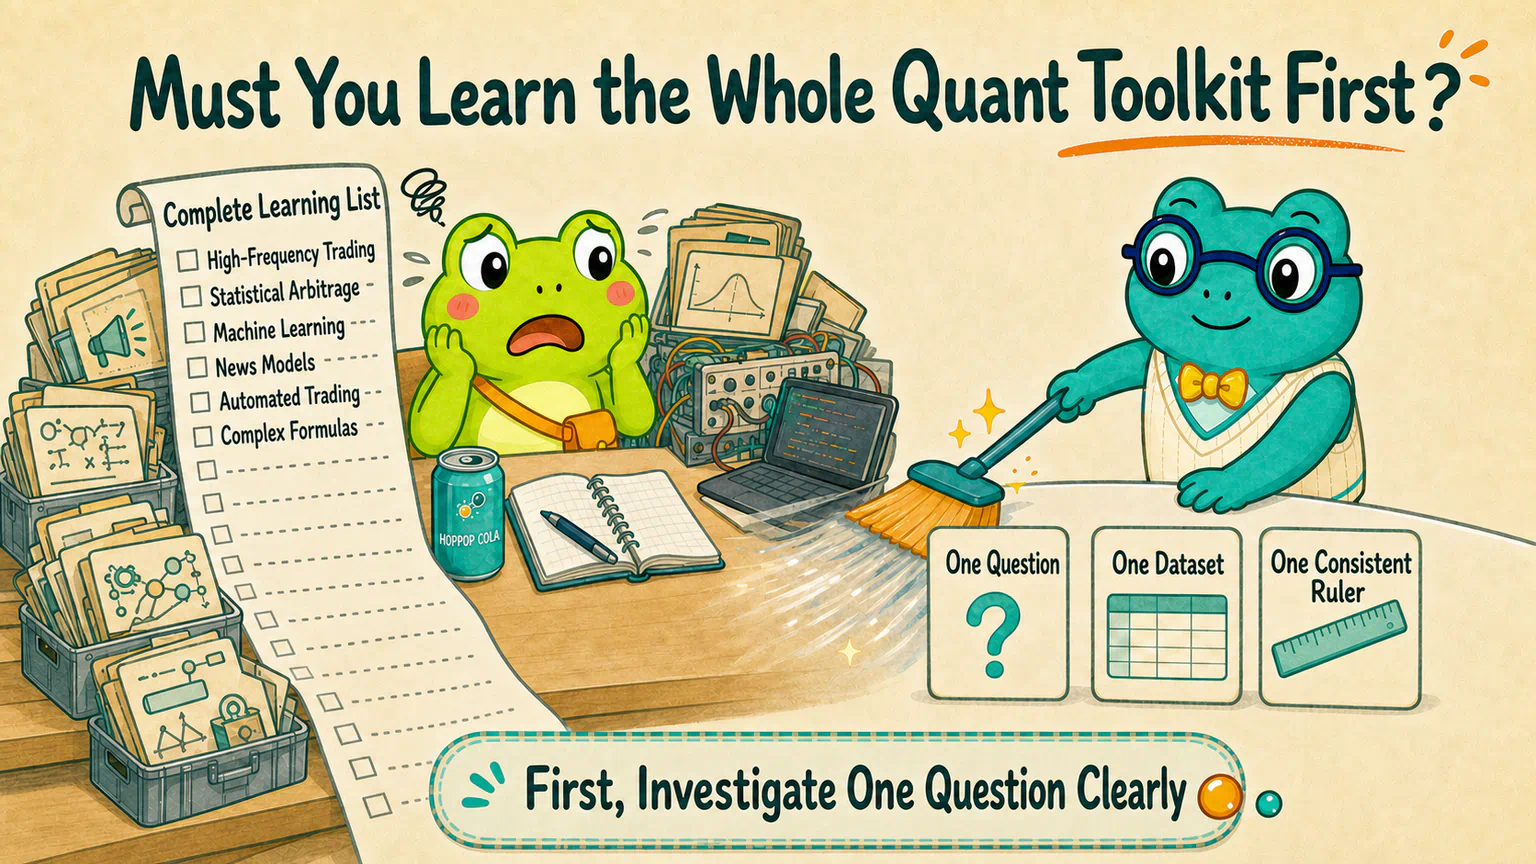
Hoppy remembered the map of the quant world and kept adding to the list:
High-frequency trading
Statistical arbitrage
Machine learning
News sentiment models
Automated trading systems
Complex mathematics
The longer the list became, the less confident he felt again.
“Do I have to learn all of this before I am allowed to begin my first experiment?”
Dr. Hop looked at the list and asked, “Which question do you want to investigate first?”
Hoppy froze.
The desk was full of parts and tools, but he had not assembled them into a route he could actually follow.
Dr. Hop picked up an eraser and cleared the list until only three things remained:
One question you can state clearly
One dataset that can help you check it
One ruler that stays the same from start to finish
“Use these three things to complete one investigation first,” he said. “You can add the other equipment later.”
Now Let Us Assemble the Parts
The hypotheses, definitions, indicators, signals, rules, and backtests from the previous lessons will become one connected route in this course.
In one slightly formal sentence, it is:
Hypothesis-driven, interpretable empirical quant research using daily data.
That sounds like a mouthful.
But each part is something we have already met. Our only job here is to decide where each part belongs.
Hypothesis-driven: start with a question, then look for evidence
Each investigation begins with a real question rather than a hundred indicators followed by whichever result happened to look best:
- Do stocks with lucky numbers in their names behave differently afterward?
- After a falling Nine-Beat Count completes, is the price more likely to rebound?
- When a certain signal appears, does trading-volume behavior change what happens next?
An idea may come from everyday intuition, a saying passed around the market, or a more complete economic or behavioral explanation.
It does not need to sound sophisticated at the start.
The minimum requirement is that we can eventually state it clearly, turn it into rules, and allow the data to answer, “No, that does not appear to be true.”
Interpretable: every step can be inspected later
Here, “interpretable” does not require every idea to begin with a grand economic theory.
“Prices may rebound after a Nine-Beat Count” is already a testable idea. If we do not yet know why it might work, we should say so honestly instead of dressing it up in a made-up causal story.
What we do require is a clear record of:
- why we chose the question;
- how every vague term was defined;
- which data we used;
- how we made the comparison;
- which result would make us revise or abandon the original idea.
If the program produces a beautiful chart, we should still be able to trace the steps backward and see where that beauty came from.
Daily-data empirical research: check the idea against actual records
The first edition of this course mainly uses daily data for individual A-share stocks and market indexes.
That means one row of prices, volume, and other available records per trading day. We will not work with microsecond trades or high-frequency order books.
“Empirical” is not as intimidating as it sounds. Alongside debating whether an idea sounds reasonable, we check what actually happened in historical data.
What Does This Route Pass Through?
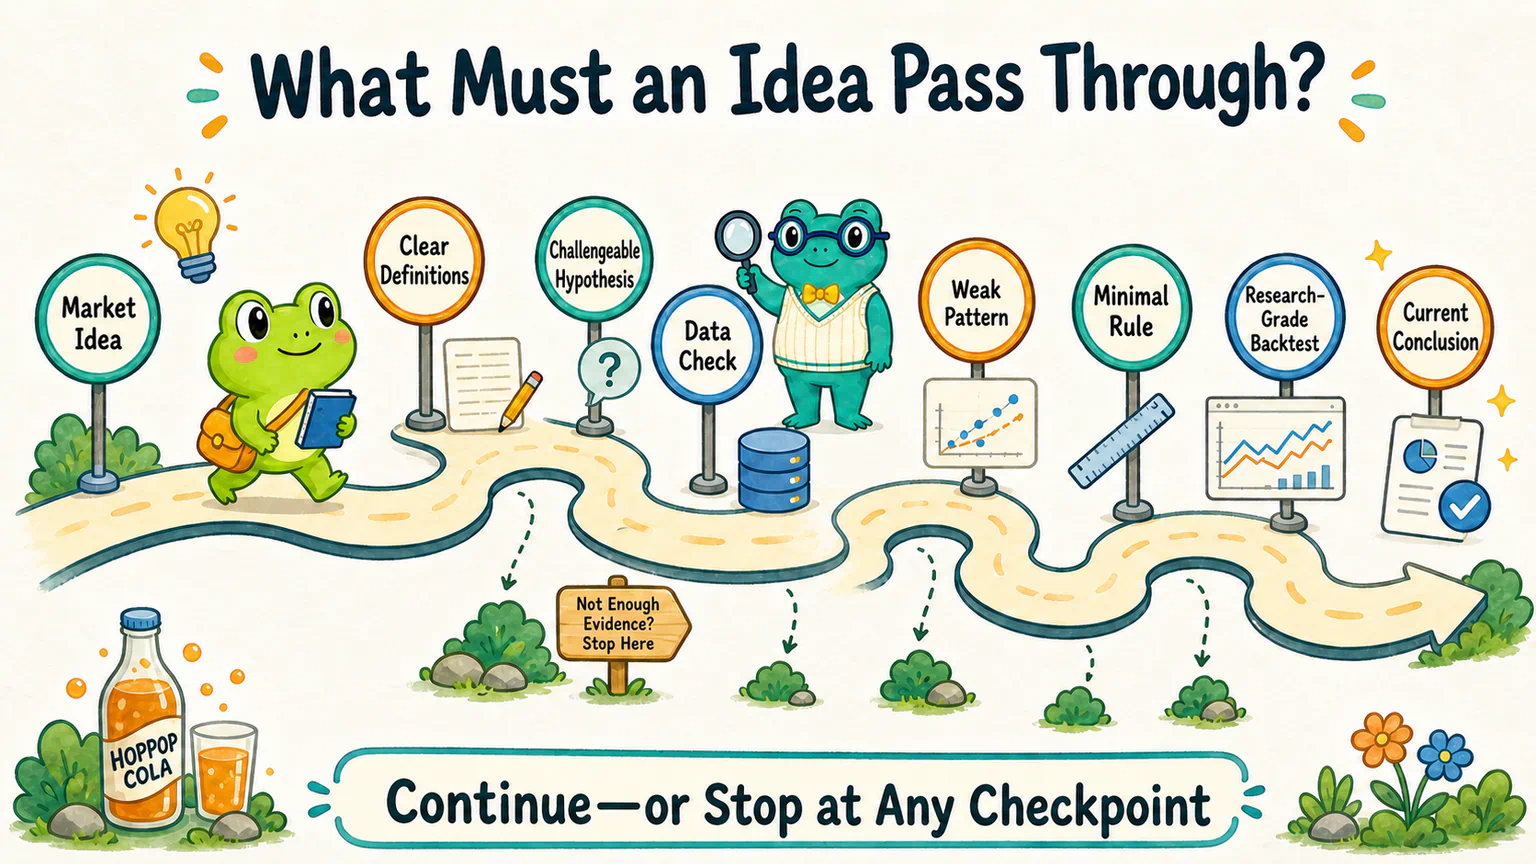
A study has to pass through several stages on its way from “I think” to an equity curve:
Raise a market idea
→ Clarify the vague words
→ Write a hypothesis that can be challenged
→ Create computable definitions
→ Check the data
→ Decide whether a weak pattern appears
→ Build a minimal trading rule
→ Run a research-grade backtest
→ Record the current conclusion and its limits
Some studies will stop halfway.
If the hypothesis cannot be stated clearly, stop. If the data is insufficient, stop. If the result does not support the idea, stop.
A route only lets evidence participate when it also allows a study to fail.
The First Experiment Starts with a Question That Will Not Scare Anyone Away
Our first hands-on question is:
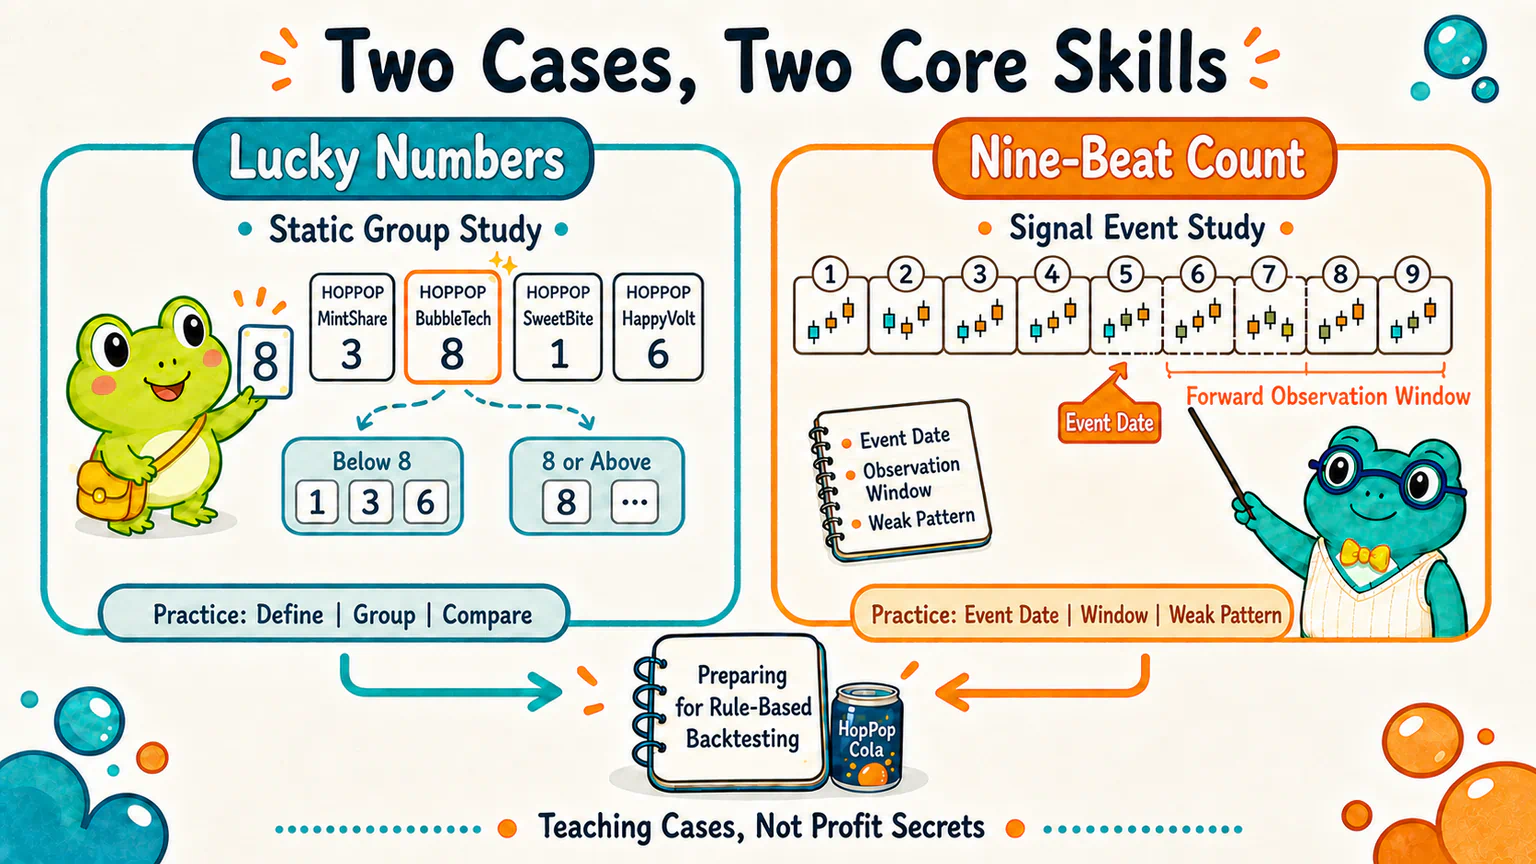
Do stocks with lucky numbers in their names behave differently afterward?
This course keeps the number 8 as the research feature because the experiment uses Chinese stock names in the A-share market, where 8 is widely treated as auspicious. An English-speaking learner does not need to share that belief; the point is to test the claim in its original market context.
The question still sounds like something overheard during a lunch break.
That is exactly why it makes a good first experiment.
You do not need advanced financial theory before you can help define it: What counts as a lucky number? Which version of each company name do we use? How far ahead do we look? What is the comparison group?
The study mainly sorts stocks into groups and compares what happens afterward.
It is a static-characteristic group study.
We use it to practice the following basic moves, not to make money from company names:
- lock the definition before seeing the result;
- check how many samples fall into each group;
- calculate every group using the same rules;
- choose a fair comparison;
- accept “no clear difference” as a complete result.
The Second Experiment Lets a Signal Appear in Time
Next, the question changes:
After a falling Nine-Beat Count completes, is the price more likely to rebound over the following days?
Nine-Beat Count, or 九拍计数, is the course's own name for the fixed 1-to-9 teaching rule used in this example. This time, simply sorting stocks into two piles is not enough.
We first need to specify which version of the sequence we mean, which day counts as completion, when the observation begins, how many trading days it lasts, and how overlapping or repeated signals are handled.
Signals appear on different dates for different stocks.
We align those event dates and observe what happens afterward.
This is a technical-signal event study.
Its first question is:
What usually happened in history after this signal appeared?
It has not yet answered:
Should we buy now?
How much should we buy?
When should we sell?
A statistical difference after an event does not mean a complete strategy already exists.
Only Then Do MACD, Market Cap, and Volume Enter the Room
Suppose the Nine-Beat Count study leaves us with a small difference worth investigating.
Hoppy will probably ask:
“Are all Nine-Beat Count events alike? Would the result change when MACD looks different, the company is larger or smaller, or trading is more or less active?”
That is a reasonable question.
But not every number involved in the calculation should be called a “factor.”
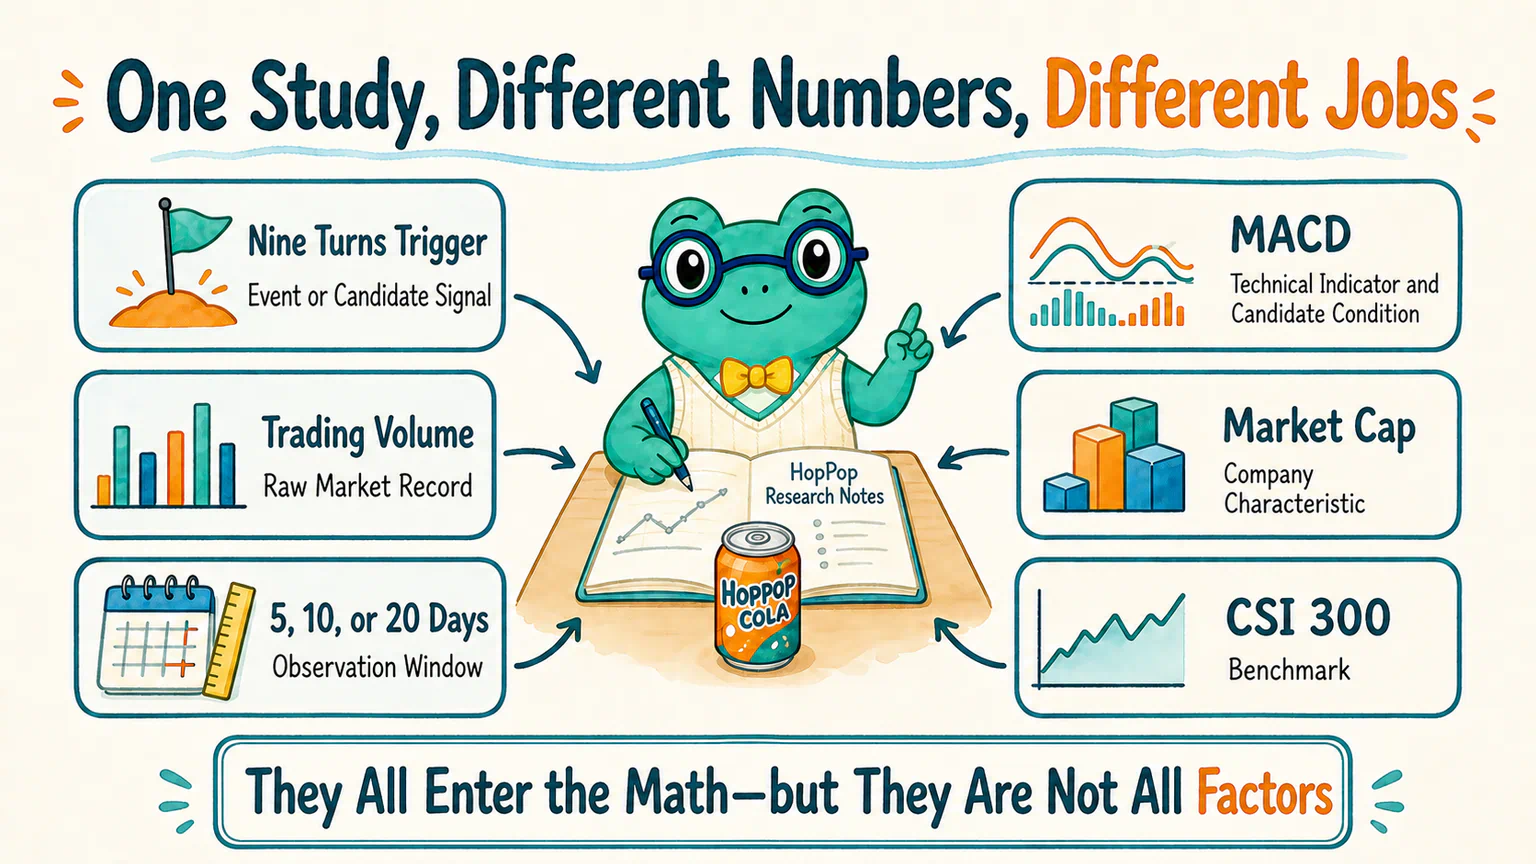
Imagine that our fictional company, HopPop Cola, has just completed a falling Nine-Beat Count:
- Nine-Beat Count completion marks the event or candidate signal;
- MACD is a technical indicator calculated from prices and can be turned into a candidate condition;
- market capitalization is an observable company characteristic that can be used for grouping or filtering;
- trading volume is a raw market record, while relative volume or turnover is an indicator created from that record;
- the next 5, 10, or 20 days are observation windows or parameters, not factors;
- the CSI 300 may serve as a benchmark, but it is not a factor either.
They can all appear in the same study while doing different jobs.
This distinction is not pointless terminology.
If we mistakenly call an observation window a factor, we may start believing that trying 3, 5, 10, and 20 days means discovering four new patterns. In reality, we may simply be picking the prettiest answer from the same historical data.
We Ask Whether a Condition Adds Information
We add a candidate condition to answer:
After learning this condition, do we know anything more than we knew from the Nine-Beat Count alone?
Perhaps the Nine-Beat Count results look messy on their own.
After splitting the events by volume behavior, one group may look more consistent. Even then, we cannot immediately announce, “The volume factor has found the buy point.”
We still need to ask:
- Does each group contain enough observations?
- Does the difference survive in another time period?
- Does it disappear completely among another set of stocks?
- Did we invent the condition only after seeing the result?
- Is there a reasonable explanation—or at least a clearly stated research reason—for checking it?
The course trains us to test, one at a time, whether a candidate condition adds incremental information, rather than asking AI for hundreds of combinations and returning whichever one looked best in the past.
How Does a Weak Pattern Become a Backtest?
If an event study leaves behind a weak pattern worth further investigation, the next step is to complete the rules.
For example:
- Which conditions must be satisfied before a candidate entry signal exists?
- Which price could actually have been known and used at the time?
- Do we exit after a fixed holding period or when another condition appears?
- How do we handle repeated signals in the same stock?
- How do we handle suspensions, price limits, and missing data?
- What consistent position-size assumption do we use?
- How do we record fees and slippage?
Once those details are clear, we have a minimal strategy that can be simulated in history.
This is a rule-driven systematic backtest.
It comes after the event study. The two are connected, but they are not the same thing.
What Does Beating the CSI 300 Tell Us?
Looking only at how much a strategy made can be misleading.
Suppose a fictional rule gained 4% during a certain period.
If the CSI 300 gained 6% over the same period, the rule lagged the benchmark by 2 percentage points.
If the CSI 300 fell 1%, the rule beat the benchmark by 5 percentage points.
Subtracting the benchmark return from the strategy return gives us the excess return relative to that benchmark.
This ruler helps us separate returns that simply moved with the market from the portion that differed from the benchmark.
But “it beat the CSI 300 in this historical sample” does not automatically mean “we found stable alpha.”
We still need to ask whether the benchmark is appropriate, what risks the strategy took, and whether the result survives in new data.
Why Begin with This Route?
Not because it is the easiest way to make money.
And not because simple methods are automatically more reliable than complex models.
We chose it because a beginner can spread the whole investigation out on the table:
- where the question came from is visible;
- how the definitions changed is visible;
- how the data entered is visible;
- which condition changed the result is visible;
- when the result fails, there is a visible path back to the problem.
Codex or WorkBuddy can help us create a project, organize data, write programs, rerun experiments, and investigate errors.
But people still remain responsible for questions such as: Why is this condition worth checking? Is the comparison fair? Is the evidence strong enough for the conclusion?
This route also lets a learner with no Python background complete a real quant investigation instead of spending months on syntax and forgetting the original market question.
The Routes We Did Not Choose Have Not Failed an Exam
The first edition needs a clear starting point, so machine learning, high-frequency trading, market making, complex arbitrage, news text, portfolio optimization, and automated execution do not sit on its main route.
These routes depend on different data, infrastructure, or research questions, and they all have value. Once you know how to propose a hypothesis, inspect data, separate exploration from validation, run a backtest, and limit a conclusion, you will be better prepared to learn them.
We do not begin by choosing the most powerful tool. We begin by choosing one question that can actually be investigated.
The course teaches you how to investigate questions. It does not hand you a standard answer for making money.
Next: If AI Can Code, What Is Still Your Job?
Hoppy picked up his learning list again.
This time, he did not write down a tool.
He wrote one line:
I think a market pattern may exist. How can I give the data a real chance to prove me wrong?
The research parts now form one complete route.
The next stage will involve plenty of implementation work: creating a project, organizing data, calculating indicators, generating signals, applying rules, checking results, and running the study again.
Codex or WorkBuddy can handle a large share of that work.
That raises the next question: if AI can write code, process data, and investigate errors, why can the human researcher not simply clock out?
The next lesson draws that line of responsibility.
References
Sources checked on August 14, 2026
- A. Craig MacKinlay: Event Studies in Economics and Finance, used to check the basic event-study structure of defining an event, an event window, and security-price behavior. This lesson adapts that structure to a technical-signal teaching case and does not claim that an event study already supplies a trading strategy.
- CFA Institute: Active Equity Investing: Strategies, used to check how factor-oriented equity research works with measurable stock characteristics and why quantitative research must account for overfitting, look-ahead bias, costs, and data mining.
- CFA Institute: Performance Measurement and CFA Institute Research Foundation: Investment Model Validation, used to check the definition of excess return against an explicit benchmark and to distinguish simple benchmark-relative return from a fuller, risk-adjusted interpretation of alpha.
HopPop Cola, the learning list, all signals, candidate conditions, return figures, and research events are fictional teaching examples. This course uses China's A-share market as its main data case. Market rules differ across countries and exchanges, but those differences do not change the research logic taught here. Nothing in this lesson promises a profitable factor or constitutes investment advice.
Lesson discussion
Share a question, insight, or different view—and see how other learners are thinking.