Lesson 1
With So Much Market Information, Why Do Investors Take Different Paths?
Start with limited attention and research scope to see why investment approaches differ—and what blind spots each choice leaves behind.
On Saturday morning, Hoppy decided to do some serious research on HopPop Cola.
The company was fictional. His determination was not.
He opened the annual report to see how the cola business was doing.
The words “raw-material costs” sent him to sugar prices. “Consumer demand” led to a beverage-industry report. That report mentioned the economy, so he opened an economic-data page. Then a news story said new industry rules might be coming, and he went looking for the policy document.
At that moment, his market app flashed an alert: HopPop Cola's trading volume had risen.
The candlestick chart, capital-flow data, and financial news joined the party.
Ten minutes later, Hoppy had more than twenty browser tabs open.
He had not figured out HopPop Cola. He had confirmed that his laptop fan was highly motivated.

If the answer were yes, most people would submit their first research note sometime after retirement.
The good news is that investment research does not require omniscience.
The less comfortable news is that it does require choices.
This course uses China's A-share market as its main source of examples. Disclosure channels, trading rules, available data, and the mix of market participants differ across markets. You must check those details in real research. The problem in this lesson travels well, though: no investor in any market can continuously process every potentially relevant piece of information.
Nobody Gets a Certificate for “Reading Everything”
We have already met many things that may affect a stock.
Companies change. Industries change. Economies and policies change. Market participants' cash needs and emotions change. News, announcements, and data keep bringing new developments into view, while prices and volume keep leaving new traces.
There is not only a lot of information. It also moves at the same time.
By the time you finish an industry report, the company may have released a new announcement. Once you check the announcement, a raw-material price may have moved. While you study that price, other investors may already have traded on a completely different story.
This is not a sign that Hoppy is lazy.
Nor is it a problem that disappears when he buys two more monitors.
Human time, attention, and understanding have limits. A professional firm can hire more people, buy more data, and build faster systems. It still has to choose which markets to cover, which questions deserve research, and which changes need immediate attention.
So the first step in research is usually not:
Read everything.
It is:
Which part will I study first?
Choosing a Scope Is Not the Same as Closing Your Eyes
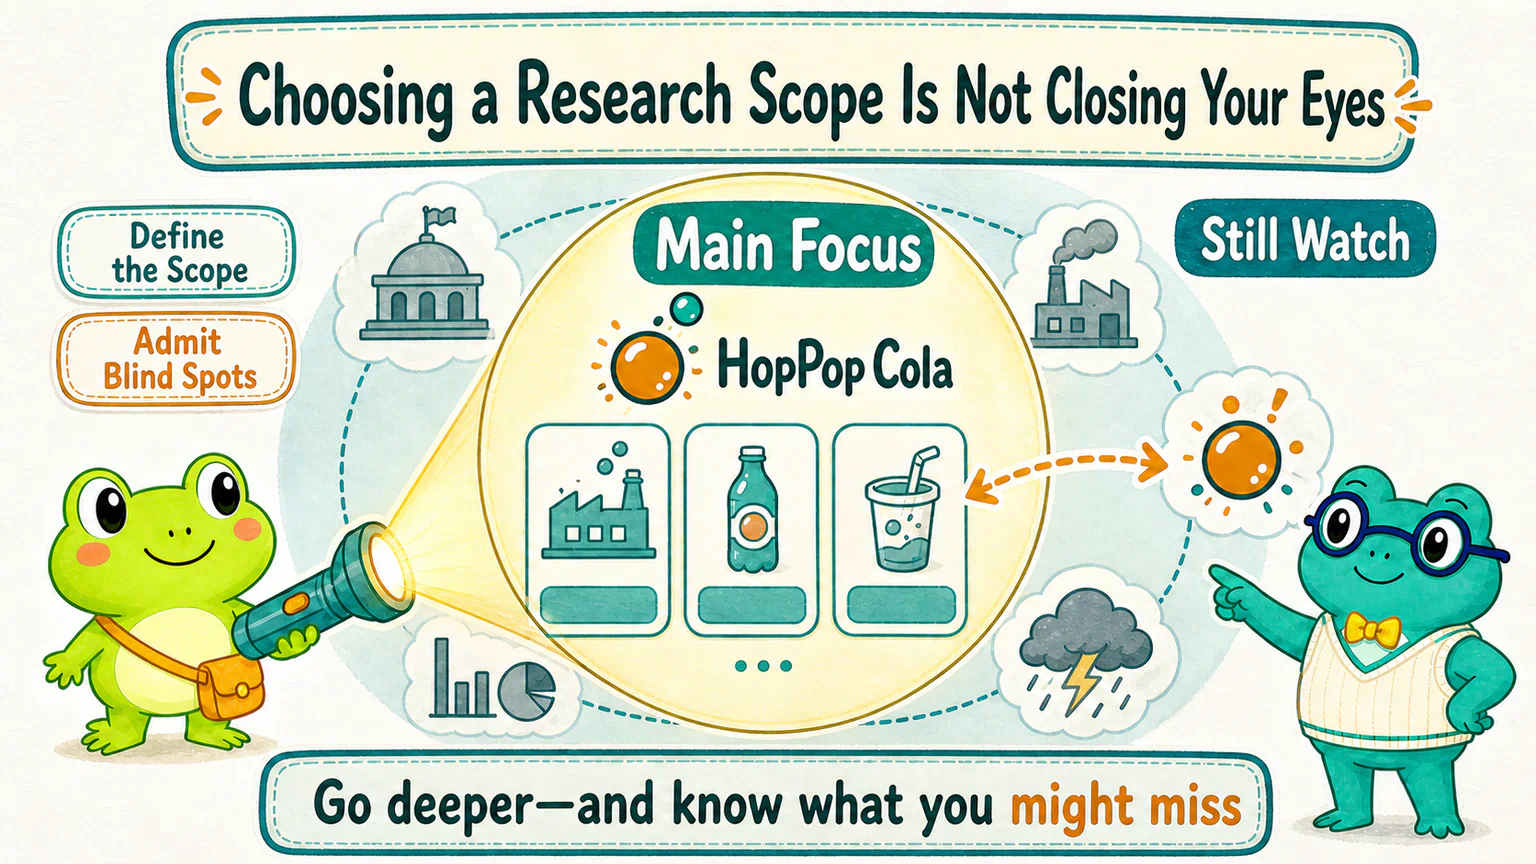
The moment Hoppy heard the word “choose,” he closed nineteen tabs and kept only the chart.
Dr. Hop restored eighteen of them.
One person might begin with the beverage business itself: units sold, prices, costs, competition, and cash flow.
That does not make interest rates, policy, consumer sentiment, or market trading disappear. It means “how the company makes money” sits at the center of the research, while other developments are checked when they may enter that center.
Another person might focus on price and volume. They do not need to write a company report every morning. But if a suspension, a major announcement, or a market-rule change produces unusual data, they cannot pretend that the chart came from a vacuum with no real-world events.
Narrowing the scope lets you study a question more deeply and consistently.
It does not let you throw a blanket over everything outside the frame.
An investment-research approach begins with trade-offs: choose a set of questions worth pursuing in a market too large to watch in full, while admitting that what you do not watch may become a blind spot.
One Market, Five Very Different Desks
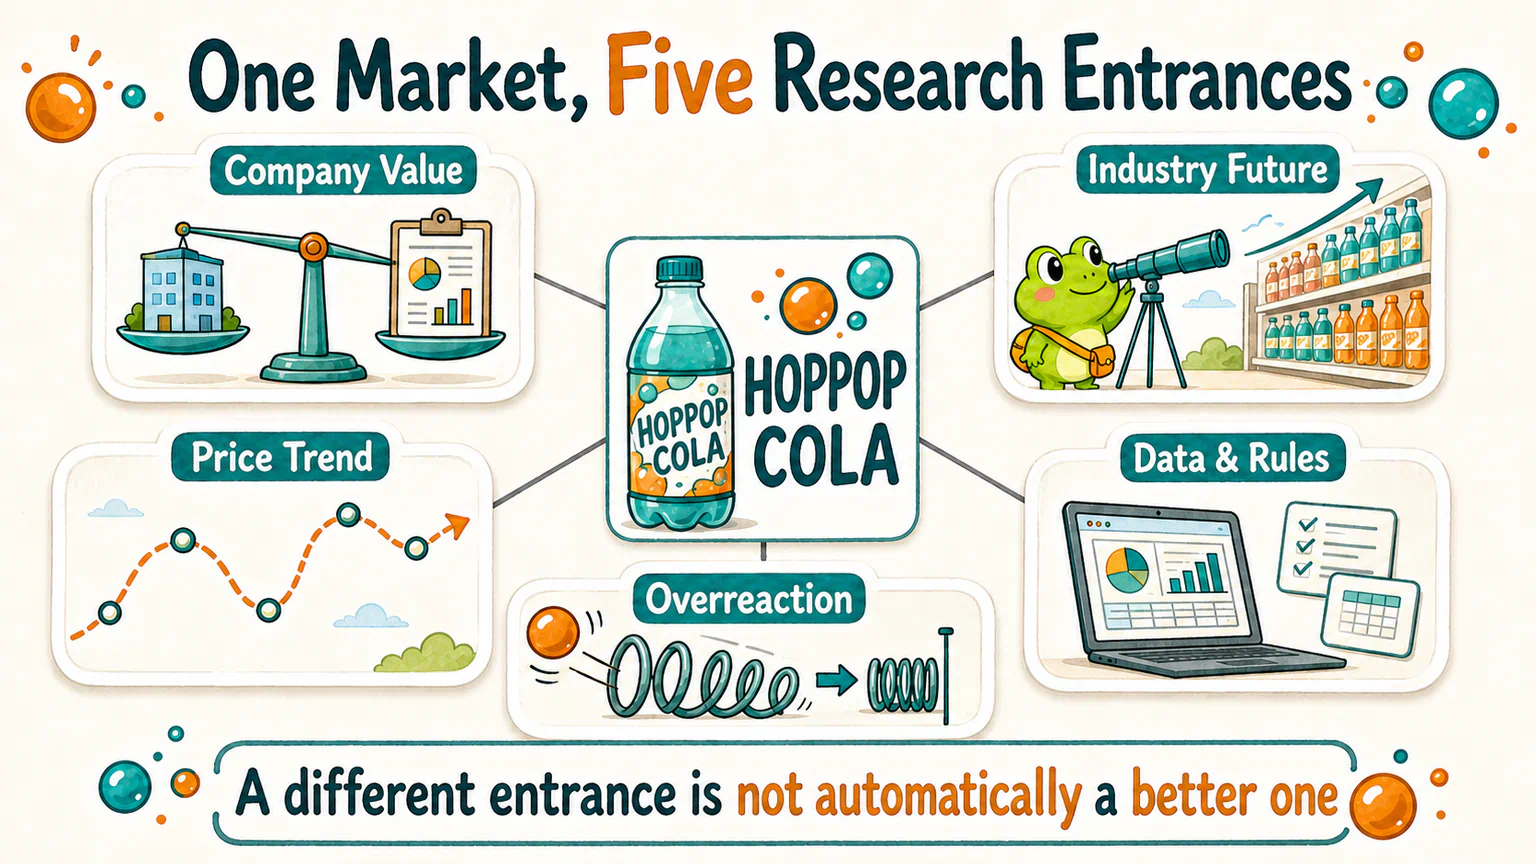
Imagine five fictional researchers sitting in one office. Each receives the same file on HopPop Cola.
They are looking at the same fictional company, but they may not begin on the same page.
Desk One: What Might This Company Be Worth?
The first researcher looks at what the company sells, how much it may earn, and whether its advantages can last, then compares that understanding with the current stock price.
The main question is whether there is a gap between the market price and the company's possible value.
Desk Two: Where Is This Industry Going?
The second researcher asks whether consumers are moving toward sugar-free drinks, whether the market may expand, how competition could change, and whether HopPop Cola can capture future demand.
Today's extra bottle is not the main concern. The question is what may grow over the next several years.
Desk Three: What Is Price Itself Doing?
The third researcher begins with whether price has kept moving in one direction, whether volume supports the move, and whether a past trend is still continuing.
This person may believe that information is not absorbed by everyone in the same instant, making the path left in market data worth studying.
Desk Four: Has the Market Gone Too Far?
This researcher looks for moments when people may have become too excited or too pessimistic.
Bad news may genuinely be bad, but did the price fall more than the business changed? A sharp rise may have a reason, but did optimism run too far ahead?
The researcher waits for a possible correction after emotion or trading pressure pushes price away from a more normal range.
Desk Five: Can Any of These Ideas Become a Rule?
The last researcher opens data and code.
They might study cheap stocks, industry trends, continuing price moves, or overreaction. The difference is that they want to state the conditions more precisely, then use a collection of historical observations to ask whether the pattern appeared repeatedly—or merely sounded convincing in one story.
The five desks do not automatically produce a winner.
They simply choose different entrances into the same market.
Real researchers do not have to sit at one desk forever. Someone studying an industry's future can also care about price. A trend researcher can pay attention to a major announcement. A person using code can study companies, industries, or market traces.
For now, we will call these different investment paths or research approaches. Everyday conversations often call them investment “styles” or “schools,” even when the labels do not describe the same kind of thing.
Different Paths Come from More Than Different Information
Two people may both want to study the beverage industry and still end up working very differently.
One is a food engineer who understands formulas, factories, and supply chains. The other has years of experience organizing price data and turning observations into rules.
One can research for six hours a day. The other has forty minutes after work.
A large team can buy detailed sales data. An individual researcher may need to begin with public announcements, industry indexes, and daily market data.
One person can wait for years without a result. Another manages money that will be needed next month. One can live with large swings. Another loses sleep after a small decline.
Knowledge, data, time, funding constraints, tolerance for risk, and available tools all affect which kind of research a person can keep doing.
An investment path is therefore not a personality quiz. It is not a poster where you point to “Team Value” and receive a matching scarf.
It is closer to a working arrangement between a person and the market:
what I mainly study
+ the conditions I actually have
+ what I am willing to wait for
+ how I intend to check the idea
Every part can change.
People gain knowledge, obtain new data, and discover that a method does not fit their time or risk constraints. A path describes how the research currently works. It is not a permanent label stamped on someone's forehead.
A Choice Creates Depth—and a Blind Spot
Someone who specializes in companies may notice an improving business before others do.
They may also underestimate a sudden industry contraction or fail to ask how much optimism the market price already contained.
Someone who specializes in price data may spot a changing trend quickly.
They may also miss that a beautiful historical pattern crosses a change in trading rules or a major company event.
A model can scan hundreds or thousands of stocks at once. It can also turn one mistaken data convention into hundreds or thousands of mistaken conclusions.
A clear research scope makes it easier to build depth. Nothing outside that scope becomes a vacuum.
A mature choice does not say, “Everything else is useless.” It can answer:
- What do I mainly watch?
- Why am I leaving other parts outside the frame for now?
- What kind of change would make me revisit the original judgment?
- What am I most likely to miss?
Admitting a blind spot does not make an approach weaker.
It finally gives the approach a boundary that can be examined.
“Value,” “Long Term,” “Technical Analysis,” and “Quant” Are Not Standing in One Line
Hoppy looked again at four familiar labels:
value
long term
technical analysis
quantitative research
They are often placed side by side, as if four teams had entered the same competition.
Look more closely, and they may not be answering the same question.
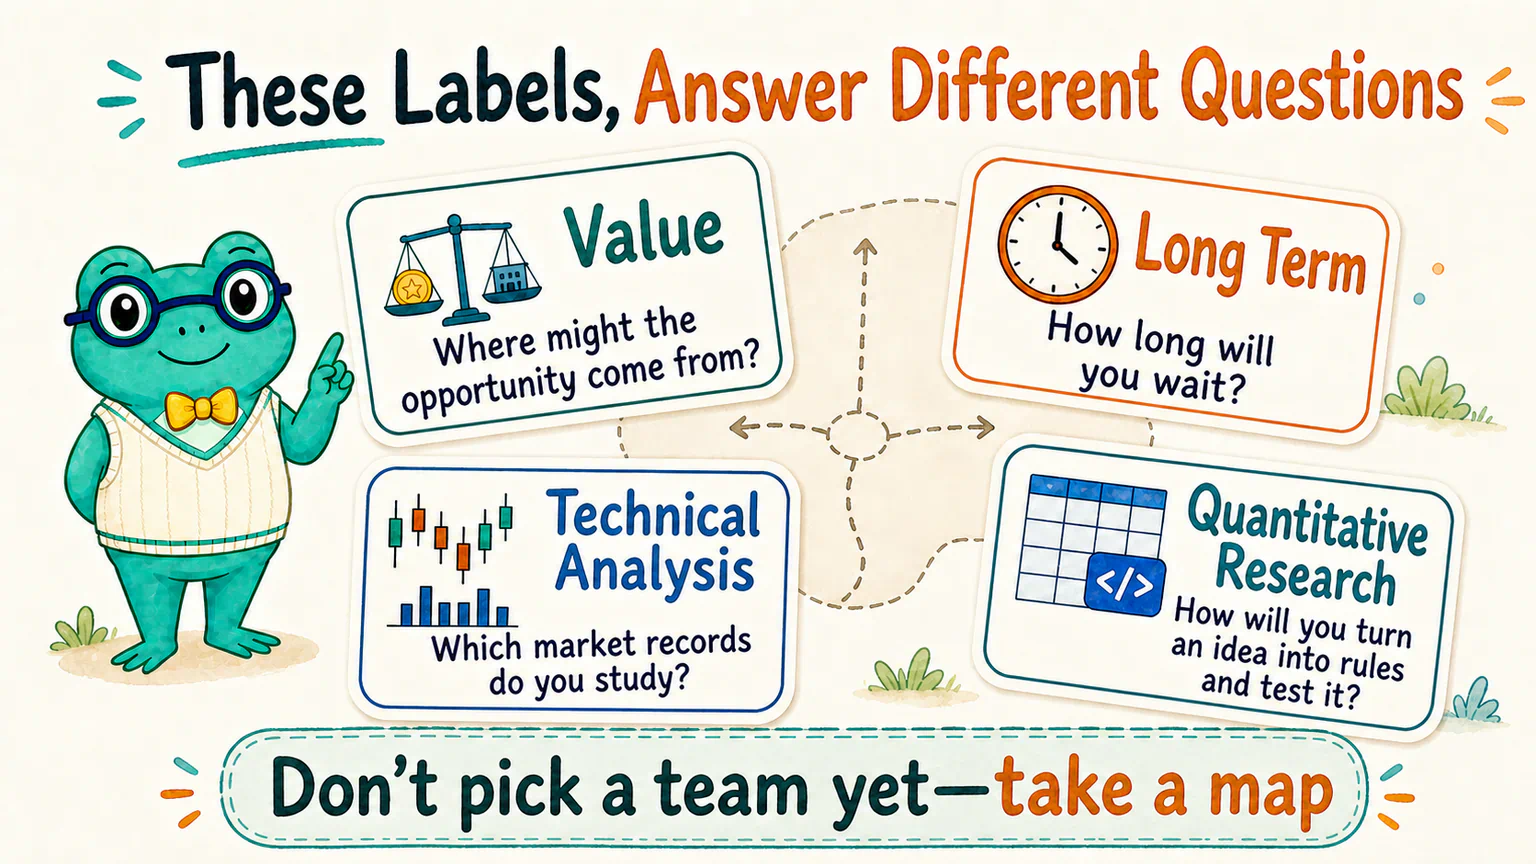
“Value” often says that an opportunity may come from a gap between price and what a company is worth.
“Long term” mainly says something about how long a judgment may need to play out.
“Technical analysis” usually says which market records receive attention and how researchers look for clues in them.
“Quantitative research” says more about whether an idea can be stated as clear rules and checked with data and code.
One person can study company value, wait two or three years, observe price behavior, and use quantitative methods to test part of the judgment.
Asking “Which is better, value or quant?” can therefore sound a little like asking:
Which is better, a spoon or dinner?
One may be closer to a tool or method. The other may be closer to the question being studied. Put them in separate places, and the conversation starts to make sense.
Do Not Pick a Team Yet—Take a Map
Hoppy finally stopped opening tabs.
He took out a sheet of paper and wrote three questions he could not yet answer:
Why might this approach have more support than a random guess?
How long is it willing to wait before judging whether something happened?
How will it find and check evidence?
These questions will not select the “best” investment style for us.
They will help us separate labels that have been mixed together.
Next, we will turn the three questions into a map. Then we can place value, growth and industry trends, trend following, reversal, and quantitative research onto it—asking where each one commonly stands and what each may fail to see.
You do not need to decide which team you belong to.
Learning to read the map matters more than collecting a jersey.
References
Sources checked on August 11, 2026
- Herbert A. Simon, “Rational Decision-Making in Business Organizations”, used for the background that real decisions are made under information and cognitive limits, requiring choices under constraints;
- Lin Peng and Wei Xiong, “Investor Attention, Overconfidence and Category Learning”, used for the research background that attention is a scarce cognitive resource and investors allocate it across different levels of information;
- Brad M. Barber and Terrance Odean, “All That Glitters”, used for evidence that individual investors face search and attention limits across a large stock universe, and that attention affects the set of choices they actually consider;
- CFA Institute, “Active Equity Investing: Strategies”, used to check that active equity research is classified in several ways—including fundamental and quantitative approaches, value, growth, momentum, and top-down or bottom-up processes—and that these labels do not all describe the same layer.
HopPop Cola, the five researchers, browser tabs, and all research scenes are fictional teaching examples. This lesson explains why research scopes and investment approaches emerge, does not rank their returns, and is not investment advice.
Lesson discussion
Share a question, insight, or different view—and see how other learners are thinking.