Lesson 3
If a Stock Looks Cheap, Is It Worth Buying?
Separate low price, low valuation multiples, and undervaluation, then place one typical value-research path on the three-dimensional map.
We now have a three-dimensional map for understanding investment approaches. It is time to carry that map into a few familiar research paths.
When the market offers more information than anyone can follow, some researchers begin with one question: How does the price I have to pay compare with what I think the business is worth?
People often call them value investors.
That label is a useful signpost, not a uniform everyone must wear. Some value investors place more weight on assets. Others focus more on earnings, business quality, and future earning power. Their waiting periods and research methods can differ too.
Let us begin with two sale tags Hoppy found.
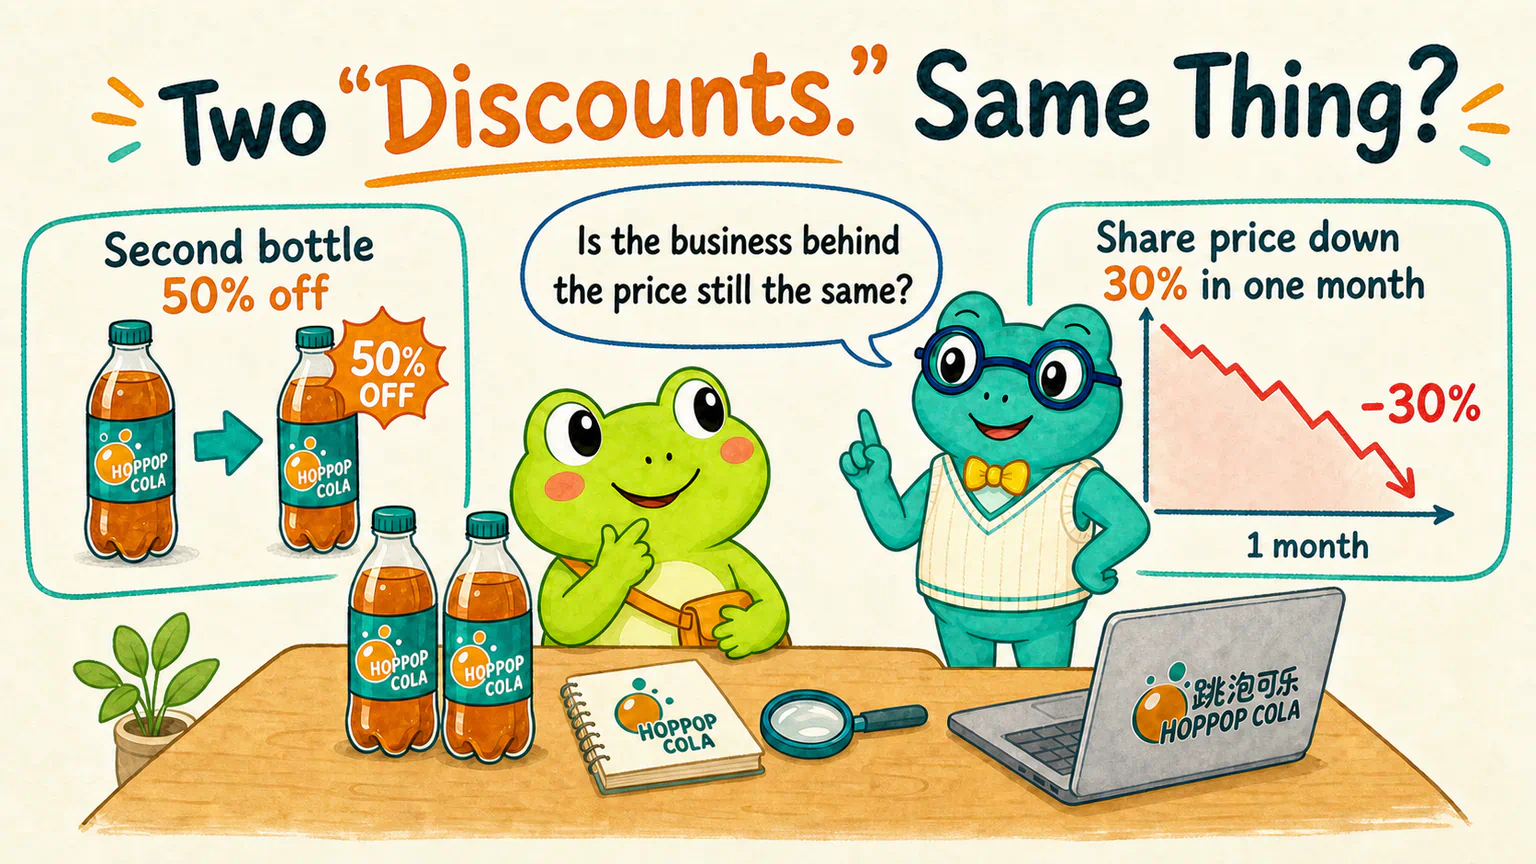
During lunch, Hoppy spotted a promotion at the convenience store: buy one bottle of HopPop Cola, get the second one half off.
He bought two without hesitation.
Back at his desk, he saw another piece of news. HopPop Cola’s shares had fallen 30% in one month.
Hoppy placed the bottles beside the screen. The longer he looked, the more the two discounts seemed alike.
Dr. Hop answered with a question:
The bottle in the store is still the same bottle. After the share price fell, is the business behind it still the same business?
Hoppy looked at the cola, then at the screen.
Both price tags had gone down. What sat behind those tags might not have stayed the same.
This course uses China’s A-share market as its main source of examples. The difference between price and value applies far beyond one market, but accounting disclosures, valuation habits, trading rules, and data conventions still vary. Check them again in the market you actually study.
A Stock Is Not a Bottle with a Sale Sticker
When a store runs a promotion, the cola’s recipe, size, and expiration date may all remain unchanged. You pay less and take home the same bottle.
A stock is more complicated.
Its price may fall because the market became too pessimistic. Or it may fall because ingredient costs rose, competition intensified, products stopped selling, or debt became harder to manage.
Sometimes only the price tag changes.
Sometimes the business behind it changes too.
That is why value research does not stop at “this used to cost ten and now it costs seven.” It keeps asking: What might this business be worth now? What could it produce in the future? Is there really a meaningful gap between that estimate and the market price?
The slightly more formal name for a researcher’s estimate of what a business or asset is worth is intrinsic value.
The term can be misleading.
Intrinsic value is not a standard answer hidden on one page of a financial report. It does not light up when Dr. Hop presses a button on his calculator. It comes from a set of judgments about assets, earning power, competition, future cash, and risk.
Change one reasonable assumption and the estimate may change too.
So a more careful researcher would not say:
HopPop Cola is worth exactly ten.
They would say:
If these assumptions hold, I currently estimate that its value falls somewhere around this range.
An estimate can be wrong. That is why a researcher may want more than “I calculated 9.90 and the market price is 9.80.” They may look for a wider gap between price and estimated value to absorb mistakes and unpleasant surprises.
That gap is often called a margin of safety.
A margin of safety is not a guarantee of safety. It simply admits that if we cannot forecast the future perfectly, paying a price very close to our own estimate leaves little room to be wrong.
What Exactly Is “Low”?
Hoppy opened his market app again and pointed to a stock priced at only two yuan.
“Surely that one is cheap?”
Not necessarily.
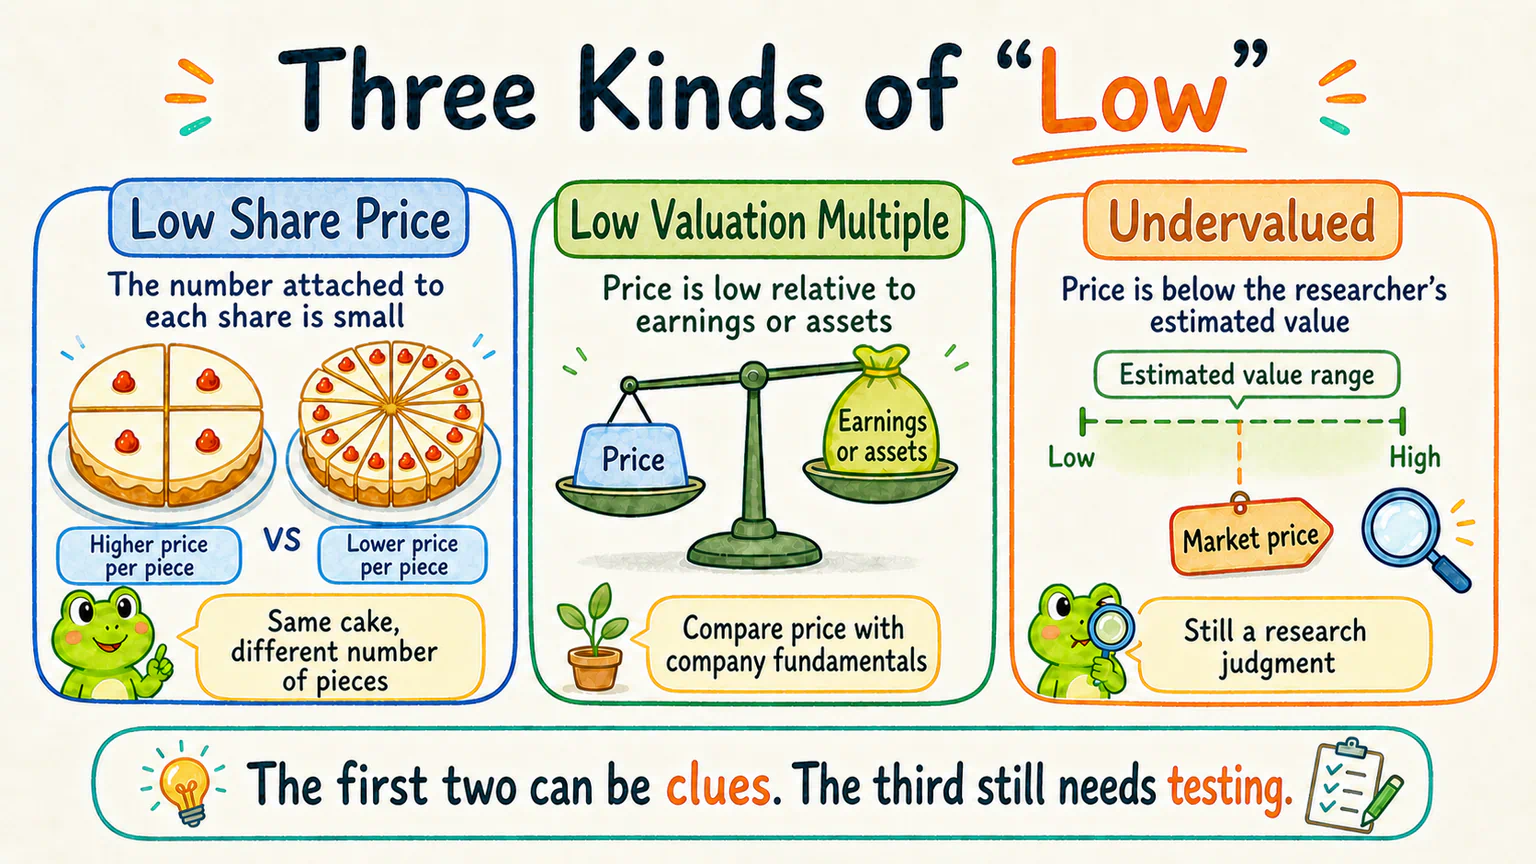
Imagine two cakes of the same size. One is cut into ten pieces and the other into one hundred. A piece from the second cake will have a lower price, but it is also a smaller piece.
Companies can divide ownership into very different numbers of shares. Looking only at two yuan per share versus two hundred tells us very little about whether the whole business is cheap.
That is a low share price, not undervaluation.
Hoppy tried another number. “What if the price-to-earnings ratio is low?”
The price-to-earnings ratio compares price with earnings. In plain English, it asks how much price the market is willing to pay for each unit of the company’s current earnings.
That comparison tells us more than the share price alone, but it still does not blow the final whistle.
A low P/E may mean the market became too pessimistic. It may also mean investors expect next year’s profit to fall. A cyclical company may be near a temporary profit peak. One-off income may make the latest number look unusually strong. Greater risk may also lead the market to pay a lower price.
That is a low valuation multiple. It still does not automatically mean undervaluation.
When a researcher says a stock is undervalued, they are making a stronger claim:
Based on my estimate of the business, its future, and its risks, the market price is meaningfully below what it may be worth.
The word my matters.
Undervaluation is not a permanent sticker attached to a stock. It is one researcher’s conclusion, built from particular information and assumptions. Other people may disagree, and the market has no deadline for proving that researcher right.
We can now put the three ideas side by side:
A low share price: the number attached to each share is small
A low valuation multiple: price is low relative to an earnings or asset measure
Undervalued: a researcher believes price is meaningfully below estimated value
The first two may provide clues. The third is still a research judgment waiting for evidence and time to test it.
Value Research Has More Than One Path
Value research is not a new idea.
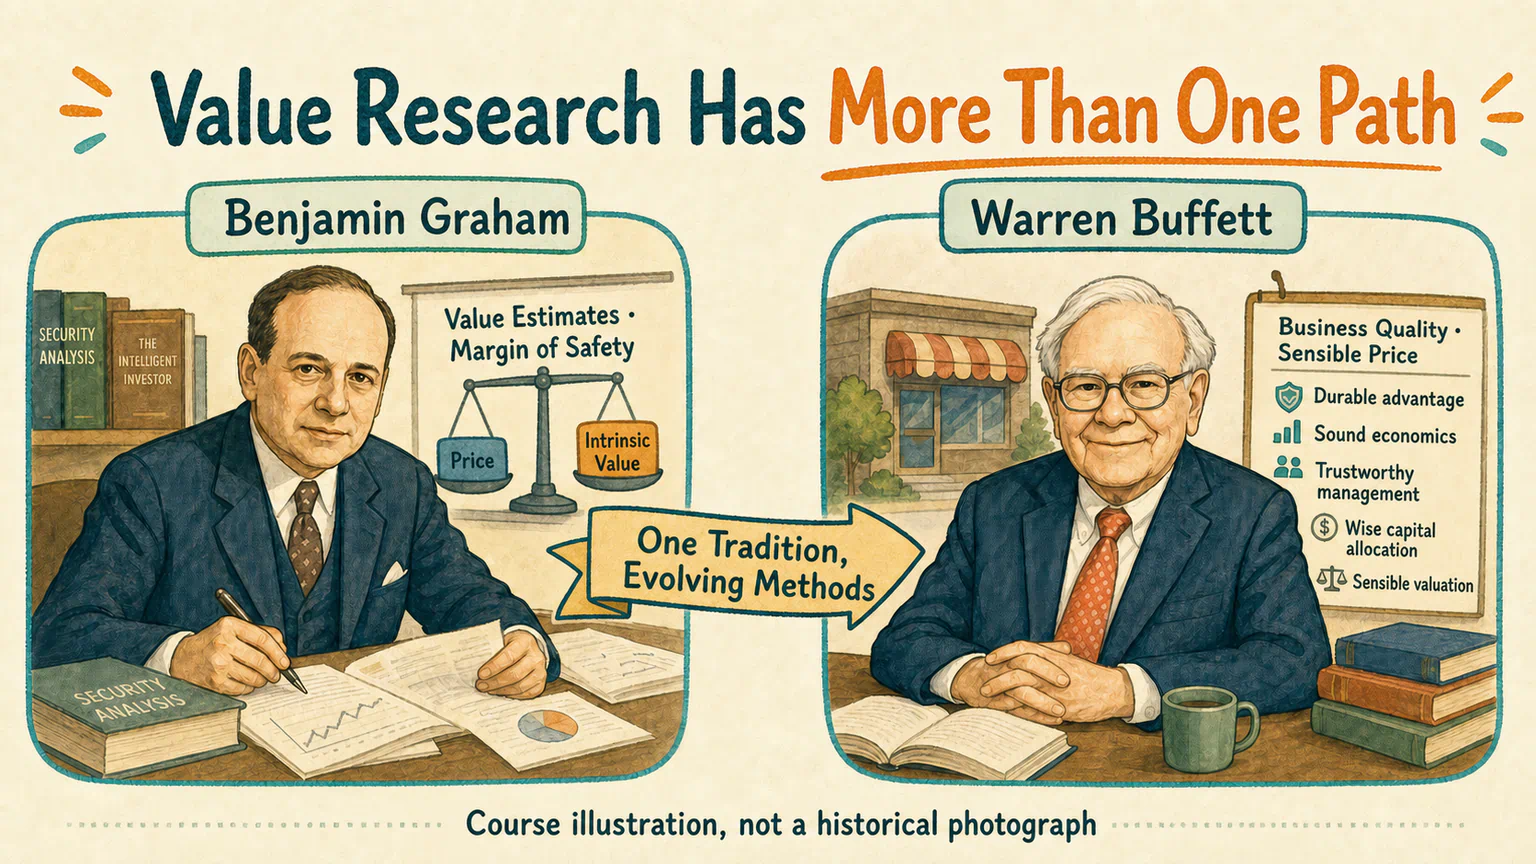
In the early twentieth century, Benjamin Graham and David Dodd developed a research tradition at Columbia Business School built around security analysis, intrinsic value, and a margin of safety. Graham often looked for opportunities whose prices sat far enough below assets and other reasonably verifiable sources of value.
Warren Buffett later studied under Graham and kept the basic language of price, value, and a margin of safety. Under Charlie Munger’s influence, however, Buffett gradually moved away from buying extremely cheap but mediocre businesses—the approach often nicknamed cigar-butt investing—and placed more weight on buying businesses with stronger economics at sensible prices.
That did not mean leaving value investing for another team.
It shows what value research is really asking: Is what I receive worth the price I pay? One researcher may lean more heavily on existing assets and current earnings. Another may give greater weight to business quality, competitive strength, and future earning power.
The same label can contain different evidence, different estimates, and different waiting periods.
We are not introducing Graham and Buffett so they can approve a stock for us. Copying one famous sentence does not produce an investment method either. The useful part of their stories is seeing how one research tradition formed—and how it continued to change.
Put Value Research on the Three-Dimensional Map
We can now return one common form of value research to the coordinate card from the previous lesson.
What does it mainly observe?
How the company makes money, what assets it owns, whether its earnings can continue, how its industry and competition are changing, and what price the market currently offers.
Where might its advantage come from?
The market may be temporarily too pessimistic. A company may receive little attention. Or the researcher may believe they have read the public information more completely. Some apparently cheap stocks may also be compensating investors for bearing greater risk.
Those are candidate explanations, not four new ways to say “undervalued stocks must rise.”
How long is it prepared to wait?
Value research often needs to leave time for the business to change and the market to reconsider, so research windows of several months to several years are common. But the word “value” does not require a stock to be held for three years, five years, or forever.
If new facts break the original thesis, more waiting will not repair it. If price quickly approaches the researcher’s estimate of value, the research may face a new decision much sooner.
How does it find and check evidence?
A researcher may examine the business, assets, earnings, cash, debt, competition, and industry, then compare the company with its own history or similar firms. Some rely mainly on business mechanisms and public information. Others use statistics to compare many stocks and ask whether low-valuation characteristics have repeatedly been followed by different outcomes.
Value research and quantitative research are not opposites. Quantitative methods can turn “cheap” into explicit conditions and check what happened historically. But a ranking metric still cannot replace questions about data quality, changes in the business, and risk.
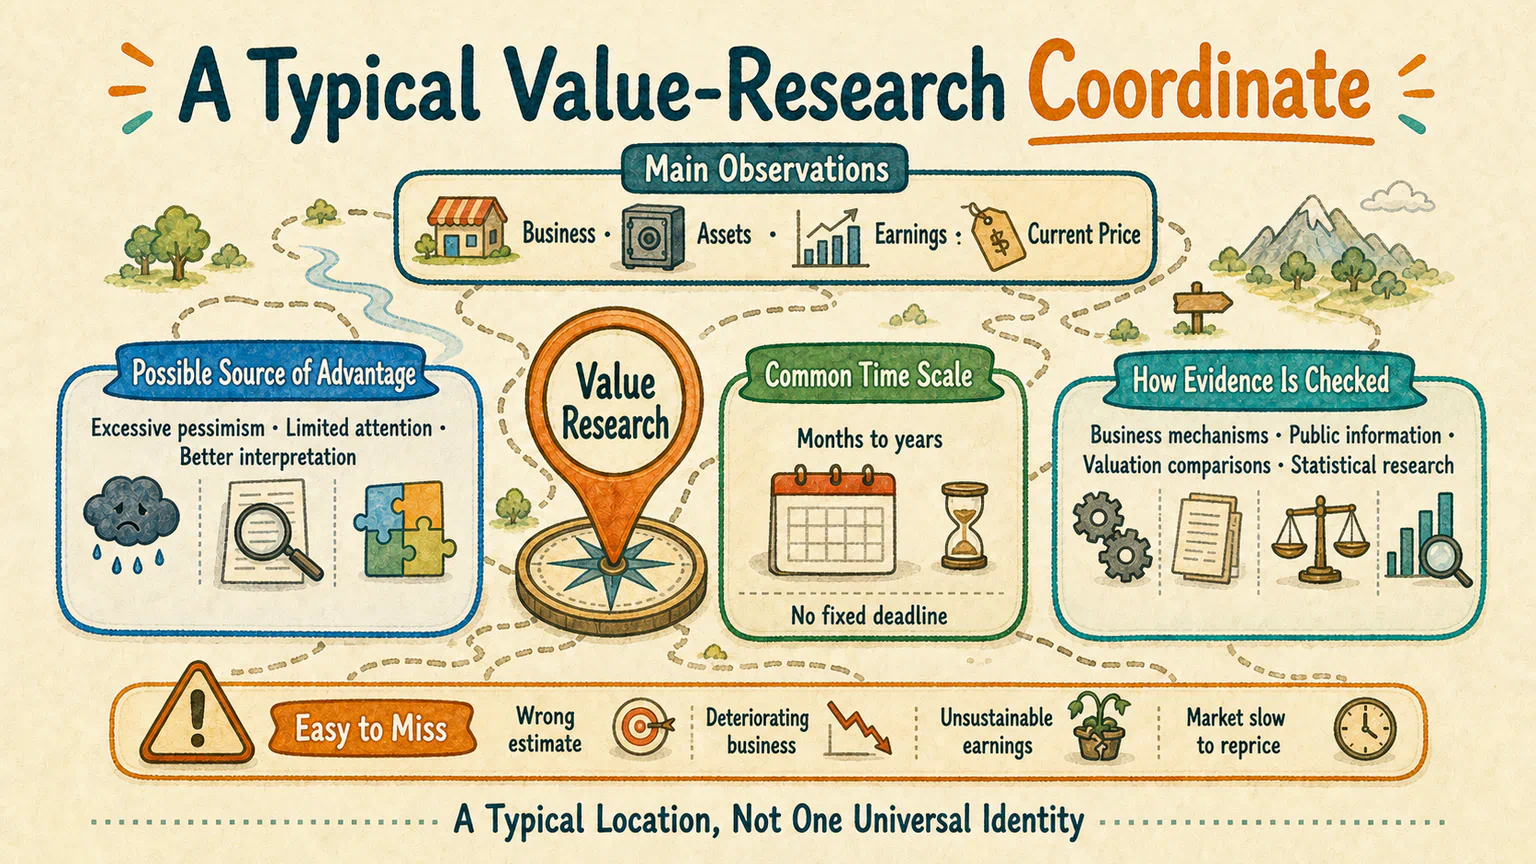
One typical coordinate card might look like this:
Main observations: business operations, assets, earning power, and current price

Possible sources of advantage: excessive pessimism, limited attention,
more complete interpretation, or compensation for risk
Common time scale: months to years, with no fixed deadline
Research methods: business mechanisms, public information,
valuation comparisons, and statistical research

Easy to miss: a wrong estimate, a deteriorating business,
unsustainable earnings, or a market that does not reprice for a long time
This is a typical location, not an identity card carried by every value researcher.
A Cheap-Looking Stock May Be Cheap for a Reason
Hoppy finally pushed the HopPop Cola price chart into the corner of his screen.
He started checking why the price had fallen.
If the market was only temporarily too pessimistic, the lower price might be worth researching. But if customers were leaving the brand, debt kept rising, profit came from a one-off item, or new competitors were making the business harder to run, price might simply be falling alongside value.
A stock that looks cheap while its underlying problems keep growing is often called a value trap.
Do not imagine that a value trap comes with its own warning label.
It often becomes visible only after a researcher underestimated change, trusted old numbers for too long, or treated a low multiple as proof of undervaluation.
Even if the researcher eventually gets the direction of value right, the result may still depend on the price paid, the time allowed, and what the market already expected. A good company in the real world is not automatically a good investment at today’s price. A cheap-looking stock does not automatically offer enough margin for error.
Next Stop: Can Growth Continue?
Hoppy did not buy HopPop Cola shares.
He did open one more industry report.
This time he wanted to know more than what the company might be worth today. Would demand for sugar-free drinks continue to grow? Could HopPop Cola capture that demand? And how much of that future had the market already priced in?
That question leads us to another familiar research path.
References
Sources checked on August 11, 2026
- Columbia Business School, “Value Investing History”, used to check the historical roles of Benjamin Graham and David Dodd in the value-investing tradition, along with the core ideas of intrinsic value and a margin of safety;
- Warren Buffett, “Berkshire—Past, Present and Future”, used to check Buffett’s retrospective account of the limits of his early cigar-butt approach and Charlie Munger’s influence on his move toward stronger businesses;
- CFA Institute, “Equity Valuation: Concepts and Basic Tools”, used to check the relationship among market price, estimated value, undervaluation, and uncertainty in valuation;
- CFA Institute, “Market-Based Valuation: Price and Enterprise Value Multiples”, used to check the meaning of price multiples such as P/E, the limitations of reported earnings, and the fundamental drivers behind the ratios;
- CFA Institute Research and Policy Center, “Value Investing: Do Quant Strategies Measure Up?”, used to check why simple valuation ratios are not identical to a complete value-research process and how value questions can also be studied quantitatively.
HopPop Cola, the share-price change, the store promotion, and every research judgment are fictional teaching examples. This lesson shows one typical location for value research and provides no valuation conclusion, stock-selection method, or investment advice.
Lesson discussion
Share a question, insight, or different view—and see how other learners are thinking.