Lesson 6
After a Big Drop, Is a Rebound Due?
Turn ‘a large decline should rebound’ into a testable hypothesis, then locate one typical set of reversal and contrarian coordinates.
The previous route began with one question: will an existing price direction continue?
Another group looks at the same rise or fall and asks almost the opposite question: Has the market gone too far?
People often call these routes “reversal research” or “contrarian research.”
The labels overlap, but they do not describe one fixed method. One researcher may study temporary price pressure over a few days. Another may study overreaction after an event. Someone else may wait years for the market to reconsider a company.
The names are road signs, not uniforms.
Hoppy had found a very short—and very frightening—decline.
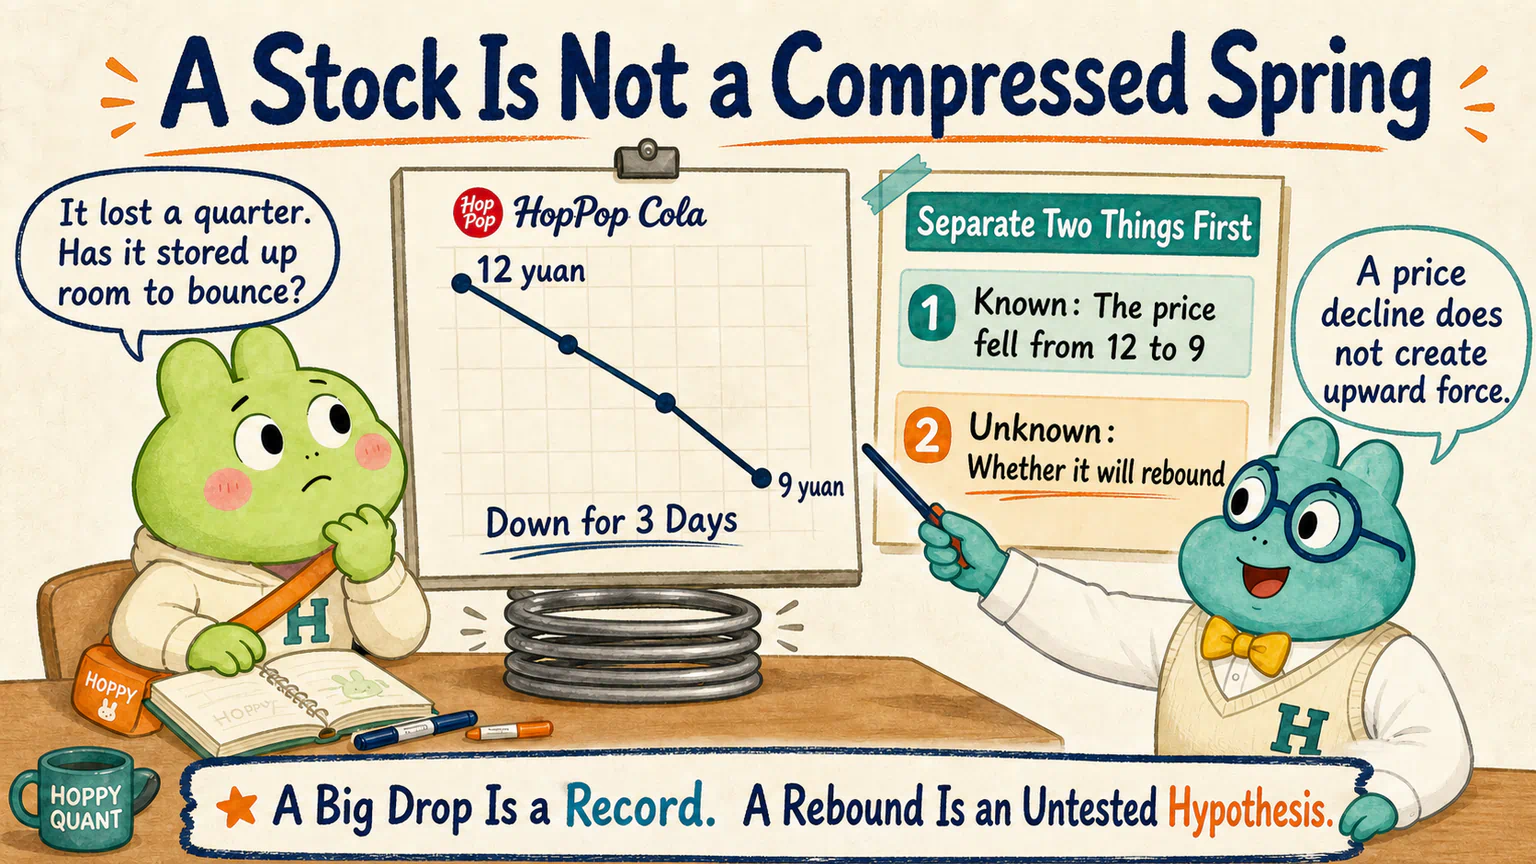
HopPop Cola’s fictional price had just risen from 10 yuan to 12. It then fell for three days in a row and reached 9 yuan.
Hoppy drew a spring compressed almost flat.
Dr. Hop looked at the spring, then at the chart.
Known: the price fell from 12 yuan to 9 yuan in three days
Unknown: whether it will rebound later
This course uses China’s A-share market as its main source of data and trading-rule examples. Price limits, T+1 trading constraints, suspensions, adjusted-price conventions, liquidity, and trading costs can all shape apparent reversals. The research logic travels across markets, but every rule and result must be rebuilt for the market you actually study.
The Same Fall to 9 Yuan Can Mean Two Different Things
First, imagine one possible story.
A fund suddenly needs cash and must sell a large block of HopPop Cola quickly. Other buyers cannot absorb all the orders at once, so the price is pushed down. The company’s products, profits, and long-term prospects have not changed by the same amount in three days.
After the urgent selling passes, buyers may return and part of the price move may reverse.
This is one candidate mechanism studied in reversal research: the price temporarily faced liquidity pressure. Part of the fall may have come from “someone had to sell now,” not entirely from “the company became worse.”
Now imagine a second story.
HopPop Cola is found to have a serious product problem. Its main distributors stop placing orders, and the company may face large compensation costs. The price again falls from 12 yuan to 9, but the business’s future earning power has genuinely declined.
Nine yuan may not be a temporarily depressed price. The market may still be absorbing bad news. The stock could continue to 8, 6, or lower.
The same decline can contain two very different stories:
Temporary pressure: someone must sell, pushing the price away for a while
Real change: the company or its environment deteriorates,
so the earlier price loses its foundation
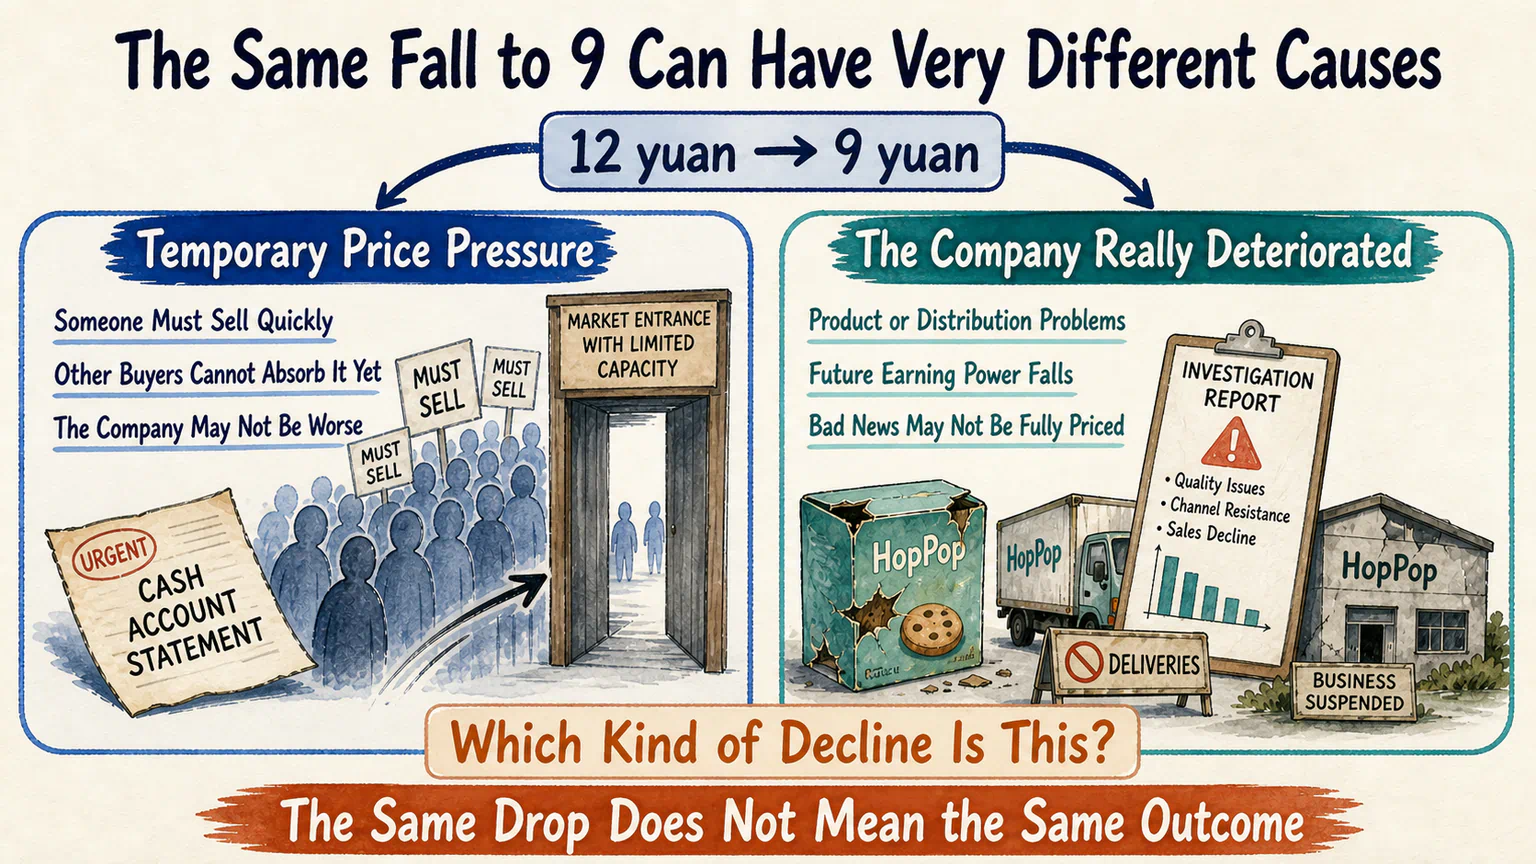
Reality rarely sorts the answers this neatly. Panic, forced selling, fundamental change, and investors revising their views can happen together.
“Everyone else is afraid” is therefore not enough. A researcher must ask why they are afraid. Is this temporary trading pressure, or have they noticed a problem Hoppy has not yet understood?
Being contrarian does not mean always standing against the market. Sometimes the market overreacts. Sometimes it simply finishes reading the bad news before Hoppy does.
Turn “It Fell a Lot” into a Testable Sentence
“It fell enough” sounds precise until we try to put it in a research document. Three blanks immediately appear.
The first blank: How much did it fall?
Was it 5% in one day, 20% in three days, or 50% in one year? Those conditions may involve very different trading pressures, business changes, and market environments.
The second blank: Compared with what?
A 10% decline may look relatively strong if the whole market fell 15%. It may be an unusual event if the market did not move at all. We could also compare the stock with its own historical volatility, its industry, or an index.
The third blank: How long afterward counts as a reversal?
Does an increase the next day count? What about recovering the loss a month later? If the stock first falls another 30% and returns six months later, did the original hypothesis succeed or fail?
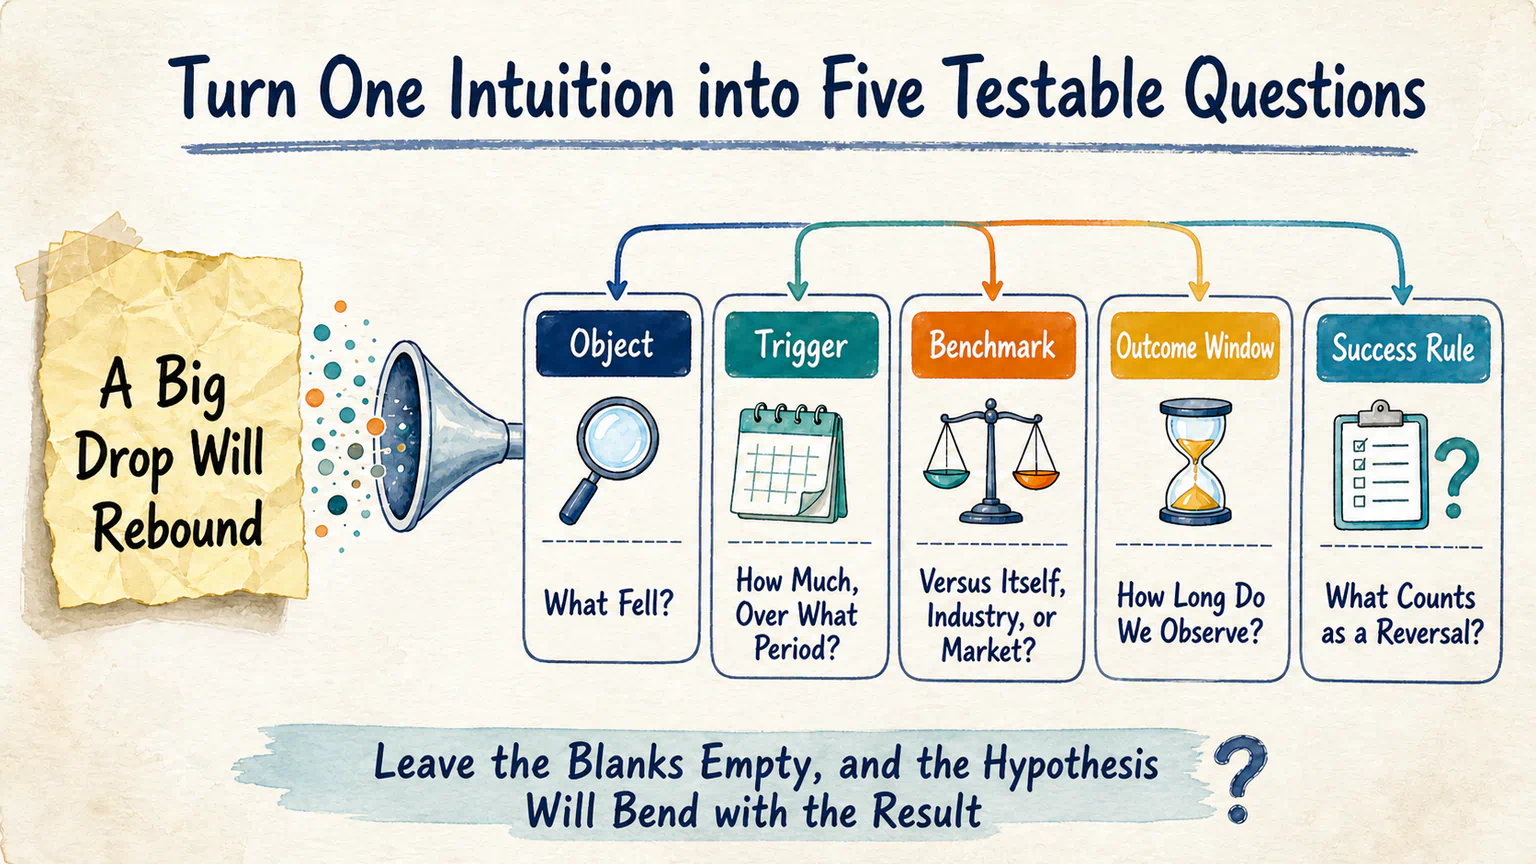
A vague intuition therefore needs at least five parts:
Object: what fell?
Trigger: how much did it fall, and over what period?
Benchmark: compared with itself, its industry, or the market?
Outcome window: do we observe days, weeks, or years afterward?
Success rule: what exactly counts as a reversal?
We do not need to fill in the numbers yet.
The important point is that, while these blanks remain empty, “large declines rebound” can be rewritten after every result and can almost never be proven wrong.
“Oversold” Does Not Mean Nothing Is Left to Sell
Hoppy pointed to another label on the screen. “It already says oversold.”
For a beginner, that word creates a vivid picture: the shelf is empty, nobody has anything left to sell, so the only possible direction is up.
That is not what it means.
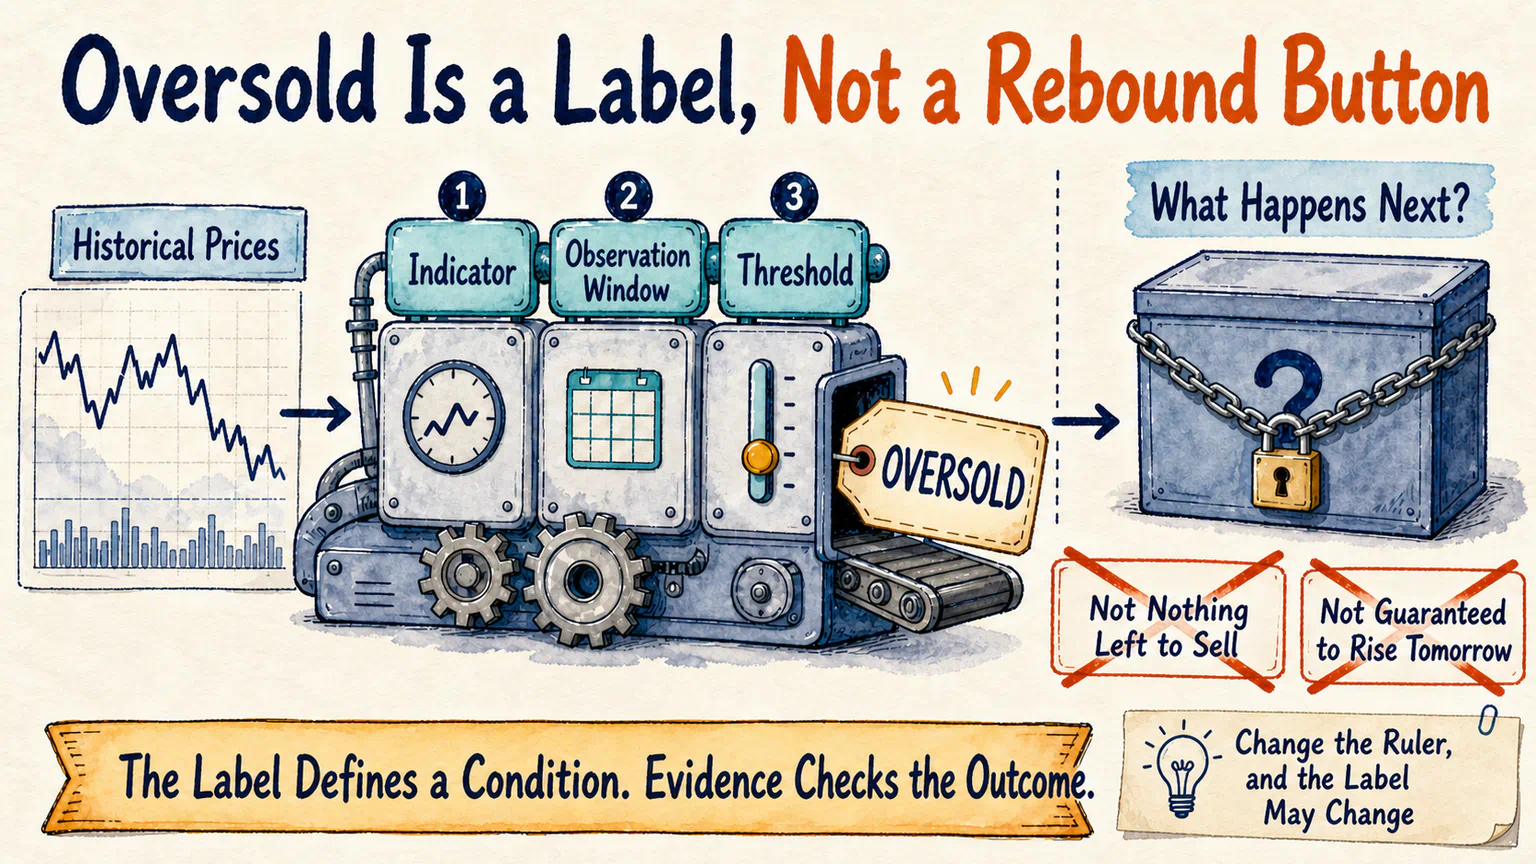
In technical analysis, “oversold” is usually a label produced when an indicator calculates a value from historical prices and compares it with a chosen threshold. Tools such as RSI and KDJ can produce labels of this kind, but they do not use identical calculations, windows, or thresholds.
We will not study their formulas here. One boundary is enough for now:
Oversold means, “According to this ruler, the recent decline or selling pressure looks extreme.” It does not mean there are no shares left to sell, and it certainly does not mean the price must rebound tomorrow.
During a powerful decline, an indicator may remain oversold for a long time. Change the parameters, market, or observation window, and both the label and the later outcome may change.
An oversold label can help define a candidate condition. It cannot explain why the company fell, and it cannot replace historical evidence about what usually happened afterward.
Hand “The Market May Have Overreacted” to Data
Werner De Bondt and Richard Thaler published “Does the Stock Market Overreact?” in 1985. They turned the idea that markets may overreact to vivid information into a question that could be examined with historical portfolios.
The study compared long-term past “winners” and “losers,” and its results were consistent with an overreaction hypothesis.
Two boundaries matter enormously here.
First, the study did not say, “Buy one stock after it falls for three days.” Its objects, formation period, and later observation window were very different from Hoppy’s instant buy-the-dip instinct.
Second, later research proposed other explanations for contrarian profits. They may involve lead-lag relations across stocks, risk, size, or compensation for providing liquidity. They do not all have to come from the market making a mistake.
The two researchers are not here to certify bottom-fishing. Their work illustrates how research begins: turn “people may have gone too far” from a comment into an evidence question with objects, windows, and comparisons.

Put Reversal and Contrarian Research on the Three-Dimensional Map
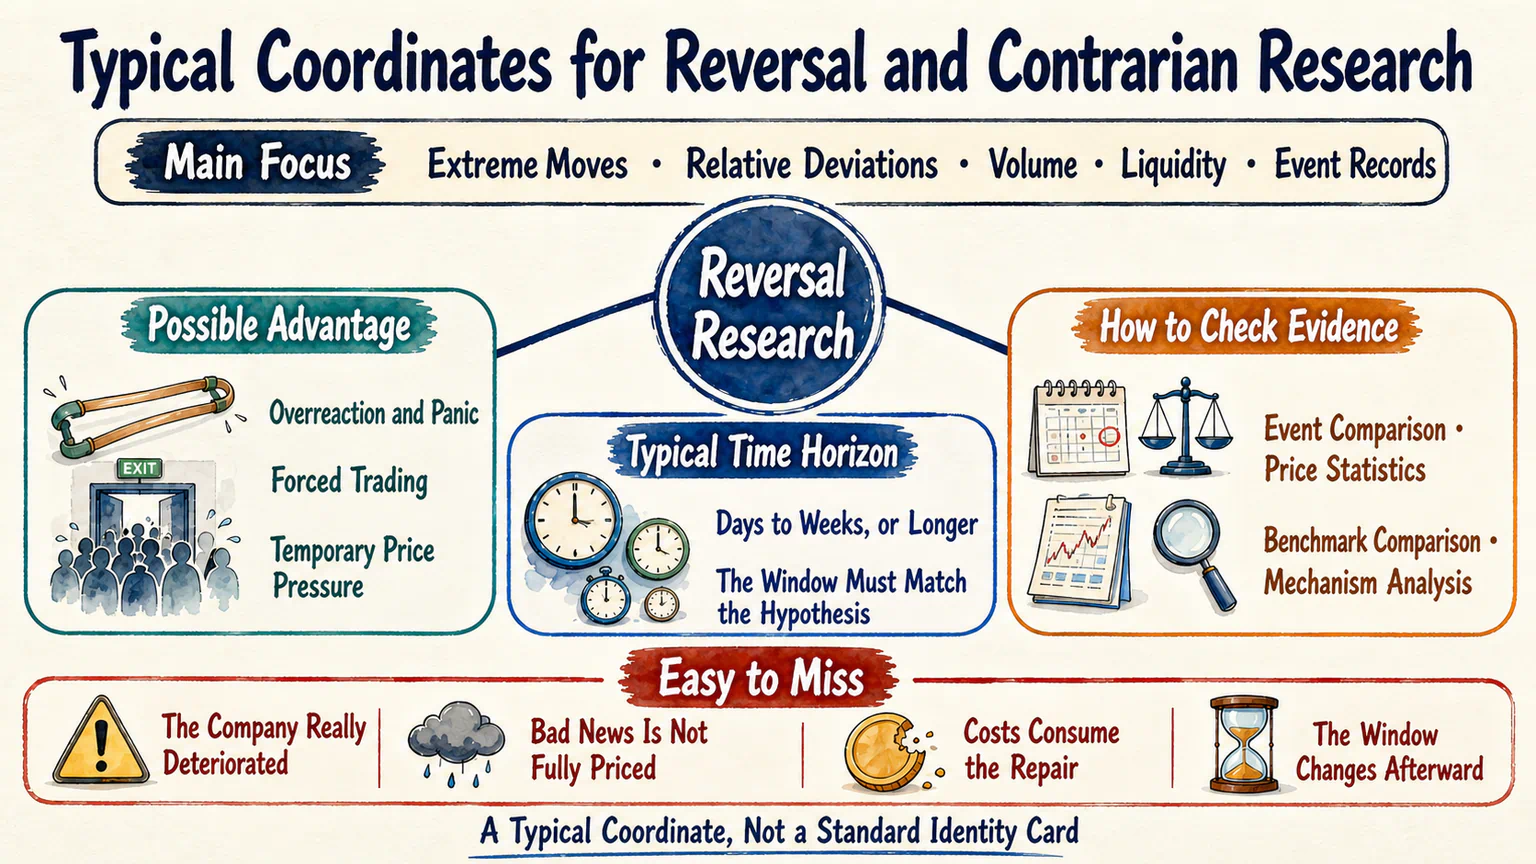
We can now place one typical form of reversal research on our coordinate card.
What does it mainly observe?
Extreme short- or long-term price moves, deviations from the market or from a stock’s own history, volume, liquidity, and price behavior around events.
Where might its advantage come from?
Panic and overreaction are possible sources. So are forced trades, temporary funding needs, and price pressure caused by insufficient liquidity.
These are candidate explanations. If a decline reflects genuine business deterioration, standing on the other side of the market may provide no advantage at all.
How long is it prepared to wait?
Short-term reversals may be observed over days or weeks. Event repair can take longer. Long-horizon contrarian research may wait years. The trigger and outcome windows must fit the hypothesis; a failed short-term idea cannot be quietly renamed a long-term position.
How does it find and check evidence?
Researchers can define extreme moves, choose a benchmark, observe the distribution of prices after events, and use volume, liquidity, and company information to examine mechanisms. Statistical results and mechanism explanations should cross-check each other.
A typical coordinate might look like this:
Main focus: extreme moves, relative deviations, volume,
liquidity, and event records

Possible advantage: overreaction, panic, forced trading,
or temporary price pressure
Typical time horizon: days to weeks, or much longer,
depending on the hypothesis
Main methods: event comparison, price statistics,
benchmark comparison, and mechanism analysis

Easy to miss: the company genuinely deteriorated, bad news is not fully priced,
costs consume the repair, or the window changes after the result
This is still a typical coordinate, not a standard identity card for every contrarian researcher.
One Decline Can Produce Two Opposite Hypotheses
Looking at HopPop Cola falling from 12 yuan to 9, a trend researcher might say: the direction is down; let us test whether it continues.
A reversal researcher might say: perhaps the move has gone too far; let us test whether part of it is repaired.
Both see the same price record and produce opposite hypotheses.
Courage and impressive route names cannot decide who is right. The research stands or falls on whether the conditions are explicit, the evidence appears repeatedly, the result survives costs, and failure is admitted when it arrives.
Next Stop: Is Quant a School of Investing?
Hoppy deleted the words “buy the dip now” and replaced them with a question:
How can I distinguish temporary selling pressure from a company that has genuinely deteriorated?
Then he noticed something interesting.
Value, growth, trend, and reversal ideas can all be written as conditions and handed to data for inspection.
Hoppy opened a new document and wrote, “Then I have decided to join the quant camp.”
Dr. Hop looked over and asked:
Which market rule does the quant camp believe in first?
References
Sources checked on August 12, 2026
- De Bondt and Thaler, “Does the Stock Market Overreact?”, used to check how the 1985 study examined the overreaction hypothesis through long-horizon winner and loser portfolios;
- NBER, “When Are Contrarian Profits Due to Stock Market Overreaction?”, used to preserve the boundary that contrarian portfolio profits need not come from market overreaction and may be affected by cross-stock relations;
- NBER, “Fads, Martingales, and Market Efficiency”, used to check early research on short-term return reversals and competing explanations;
- The Review of Financial Studies, “Evaporating Liquidity” and Journal of Financial Economics, “Trading Imbalances, Predictable Reversals, and Cross-Stock Price Pressure”, used to check liquidity provision and temporary price pressure as candidate mechanisms for short-term reversals;
- Journal of Banking & Finance, “Short-term reversals, short-term momentum, and news-driven trading activity”, used to check that liquidity-driven reversal and news-driven continuation can coexist;
- CMT Association, “Technically Speaking, June 2023”, used to check the oversold interpretation of RSI and its mixed historical record as a reversal-timing tool; this lesson does not teach the indicator or its signals.
HopPop Cola, the move from 12 yuan to 9 yuan, the fund sale, and the product problem are fictional teaching examples. They do not describe a real company, stock, event, or strategy. This lesson introduces one typical location for reversal and contrarian research on the three-dimensional map; it does not provide bottom-fishing signals, parameters, backtest results, or investment advice.
Lesson discussion
Share a question, insight, or different view—and see how other learners are thinking.