Lesson 2
To Understand an Investment Approach, Ask Three Questions
Use source of advantage, time scale, and research method to separate investment labels from research tools.
Hoppy placed four cards on the table:
value
long term
technical analysis
quantitative research
Then he carefully drew a tournament bracket.
Value would face long term in the first round.
Technical analysis would face quantitative research in the second.
The winners would meet in the final to decide the “best investment school.”
Dr. Hop watched for a moment, then asked:
Hoppy picked up his pen, then put it down again.
All four cards could describe the same person.
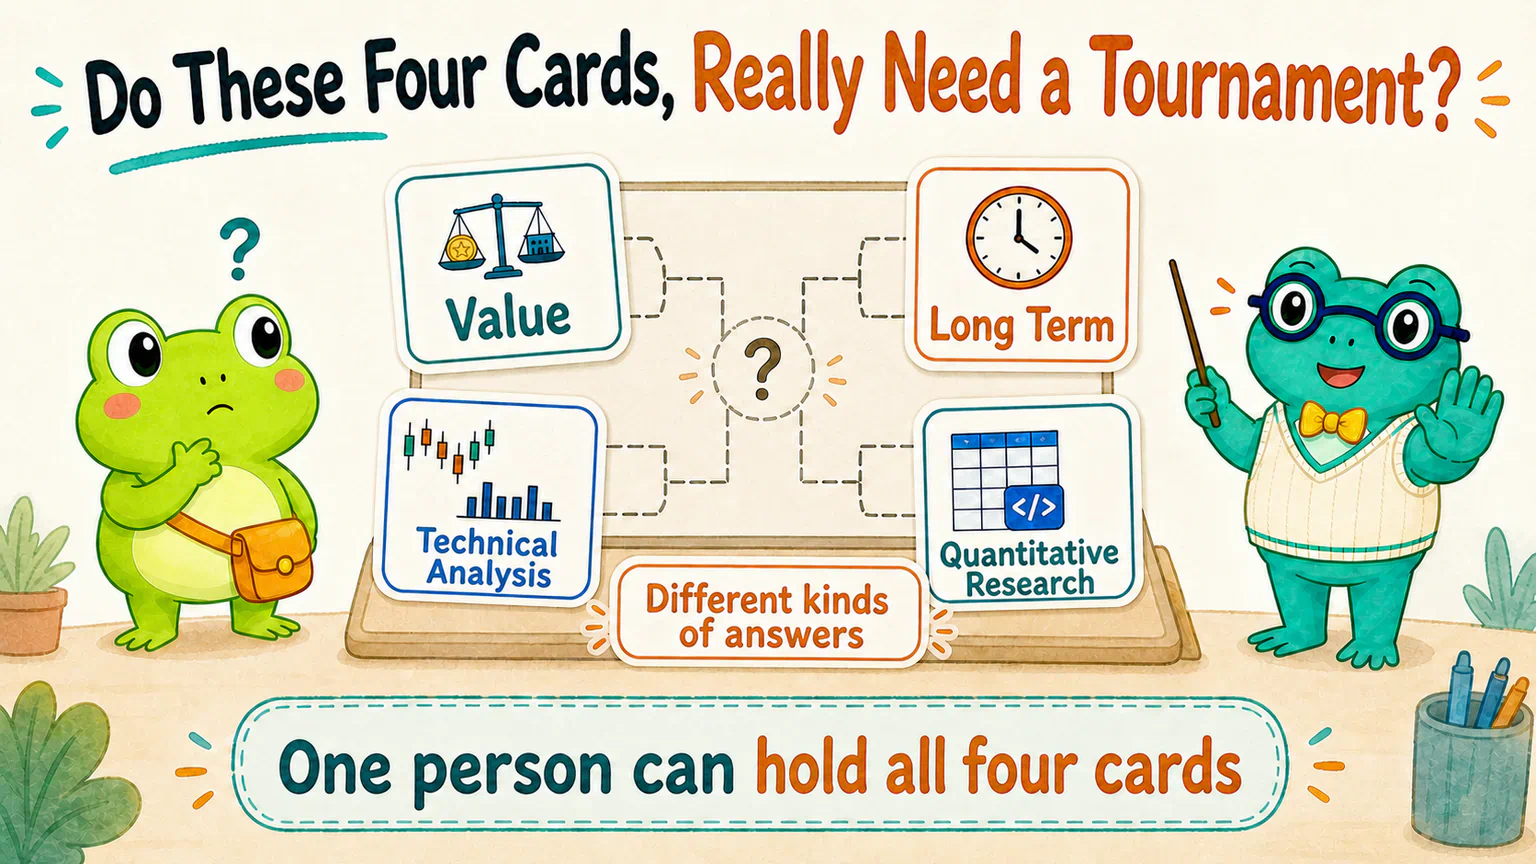
Making those labels fight is a bit like asking “Where are you going?”, “How long will the trip take?”, and “How will you get there?” to compete against one another. They all matter, but they answer different questions.
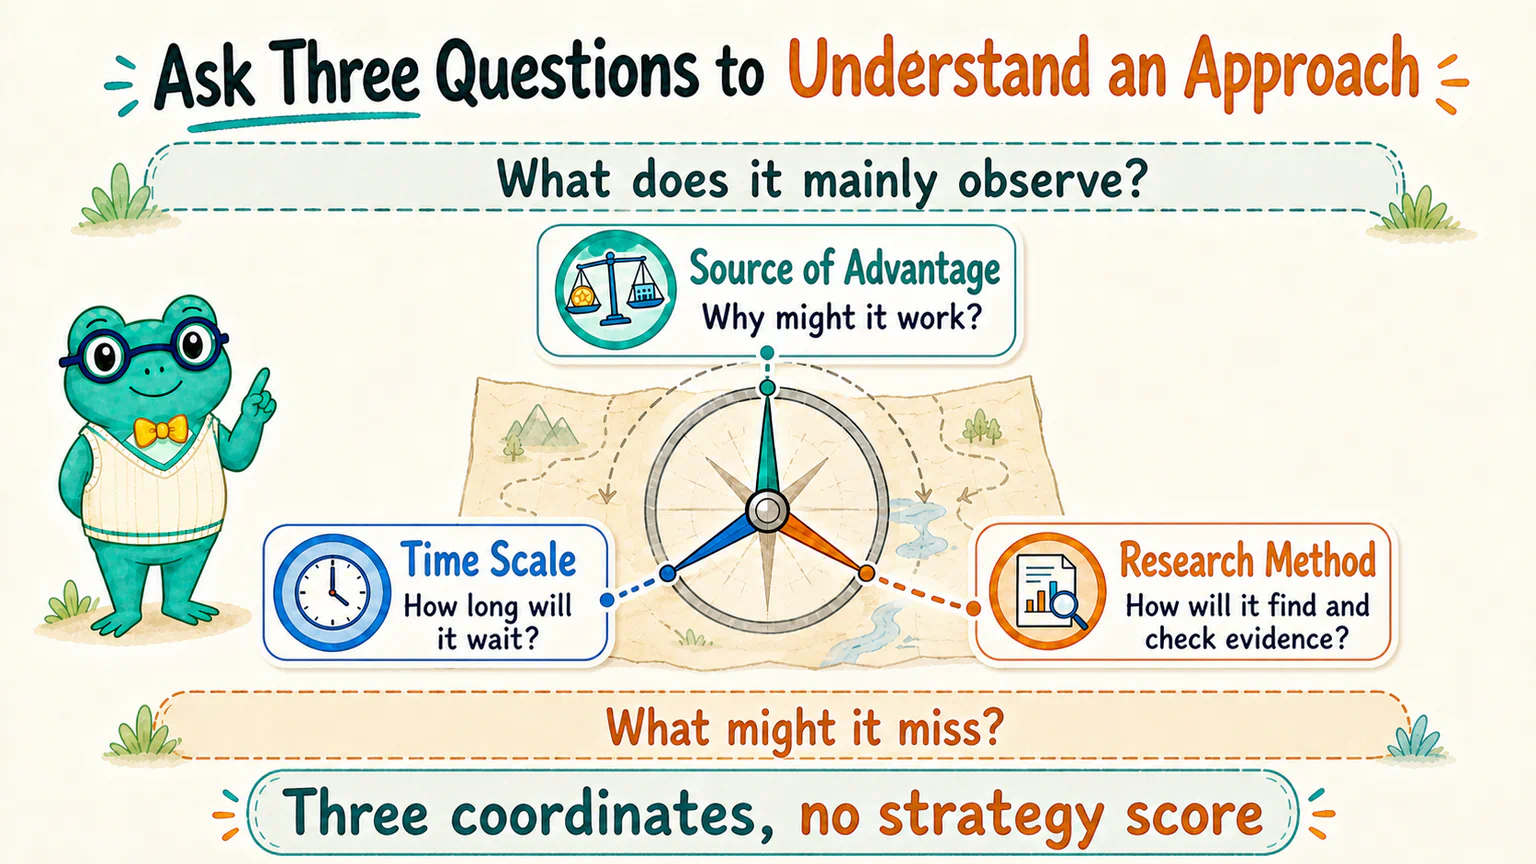
So when we meet an investment approach, we do not need to start by asking which school it belongs to.
Three questions will do:
Why might it work?
How long is it prepared to wait?
How will it find and check evidence?
Those three questions form the map we will keep using throughout the course.
This course uses China’s A-share market as its main source of examples. Trading calendars, price-limit rules, disclosure channels, institutional constraints, data conventions, and trading costs differ across markets. The three questions still travel well, but their answers must be checked again in the market you actually study.
Question One: Why Might It Work?
Suppose someone tells Hoppy:
I buy stocks after their prices have fallen a lot.
That tells us what the person watches. It does not yet tell us why the approach might work.
A big fall may mean the market became too pessimistic. It may mean the company genuinely got worse. Both may be true at the same time.
So we need one more question:
Why do I think this is more than a lucky guess?
The slightly more formal name for this is the source of a possible advantage.
Hoppy asked, “If I can come up with a reason for my idea, have I found the advantage?”
Not yet. A reason is only the beginning of the research.
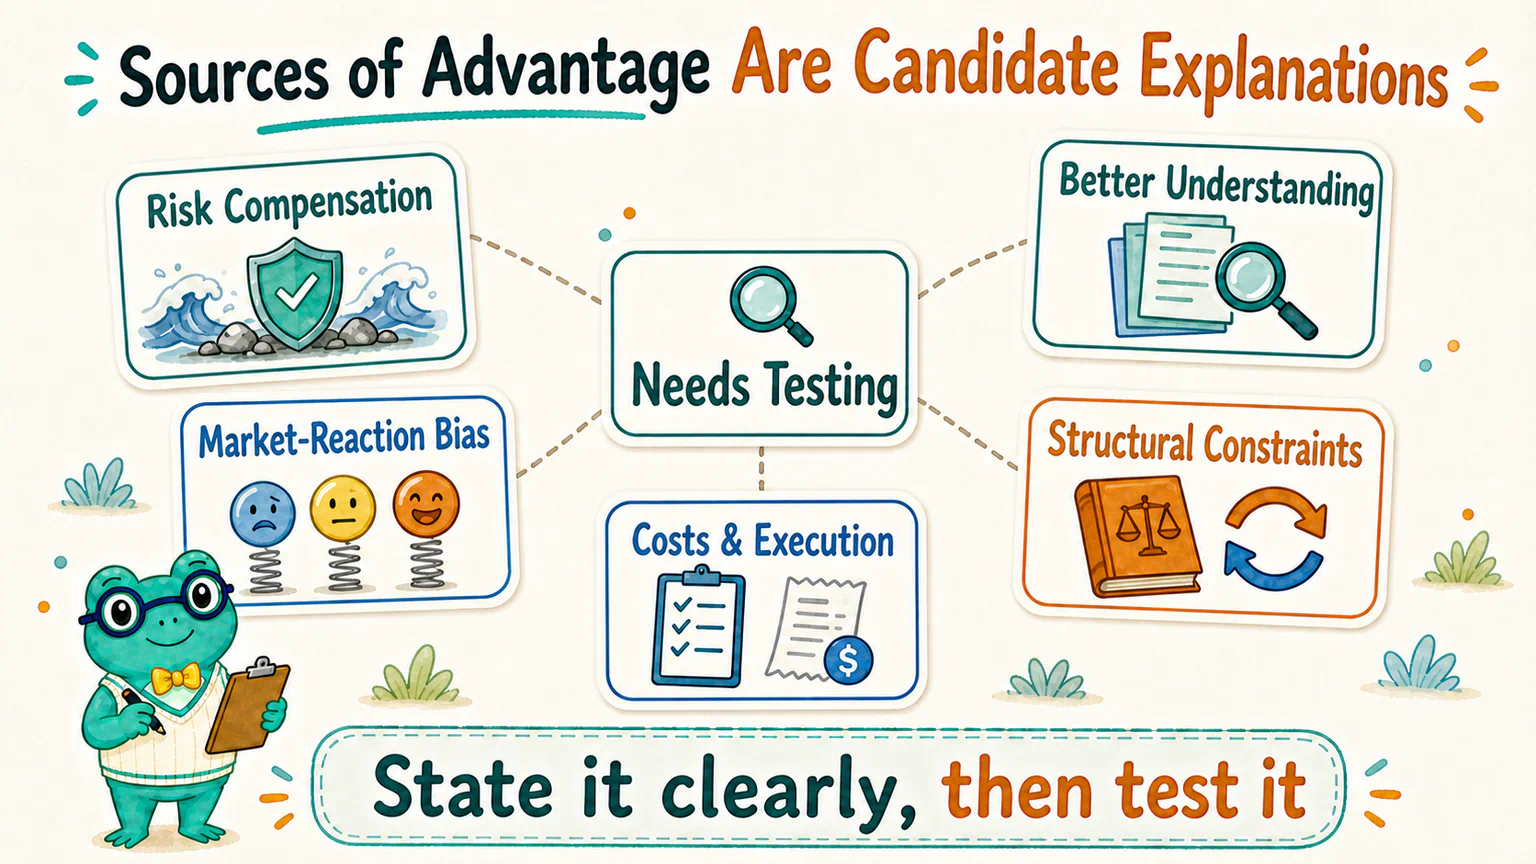
Some approaches may appear to earn more because holding them is unpleasant. Their prices swing harder, they may be difficult to sell, and they can suffer especially badly when the whole market is in trouble. If extra returns really exist, they may be compensation for bearing risks that other people would rather avoid.
Sometimes an opportunity may come from the market becoming too excited or too pessimistic, or from people taking time to understand new information. But that idea cannot be shortened to “Everyone else is irrational, and I am the only one thinking clearly.” Without specific conditions and evidence, “the market is wrong” is just a very convenient way to comfort ourselves.
Another researcher may have no secret information at all. They may simply read public material more carefully. Where someone else stops at “demand is growing,” they continue checking competition, costs, production capacity, and whether the share price already reflects that growth.
Some trades do not happen because anyone suddenly changed their opinion. A fund may need to follow portfolio rules. An index may rebalance. An institution may trade because of redemptions, risk limits, or an urgent need for cash. When someone has to trade, they may leave behind a pattern worth studying. That does not mean everyone watching from the sidelines can automatically profit from it.
Finally, two people can discover the same pattern and still get different results. One changes the rules every few days. The other follows a process and honestly includes fees, slippage, and data errors. An advantage may come not only from what someone discovers, but also from whether they can carry it out consistently.
There is no need to memorize all those labels yet.
For now, remember one thing: an investment approach should explain why it might have a little more support than a random guess. That explanation must still face a test. It cannot award itself a certificate.
The source of a possible advantage answers, “Why do I think this is more than a lucky guess?” It begins as an explanation to test, not a promise of returns.
Question Two: How Long Is It Prepared to Wait?
Hoppy wrote “long term” next to “the industry’s future.” Then he wrote “short term” next to “price trend.”
Dr. Hop asked, “How short is short? And long compared with what?”
Hoppy had no answer.
Five trading days may feel long to an intraday trader. For someone studying a factory expansion, three months may be barely enough for the equipment to arrive.
Once research begins, it is better to replace “short term” and “long term” with a period we can actually check: the next five trading days, the next three months, one year later, or perhaps two to three years.
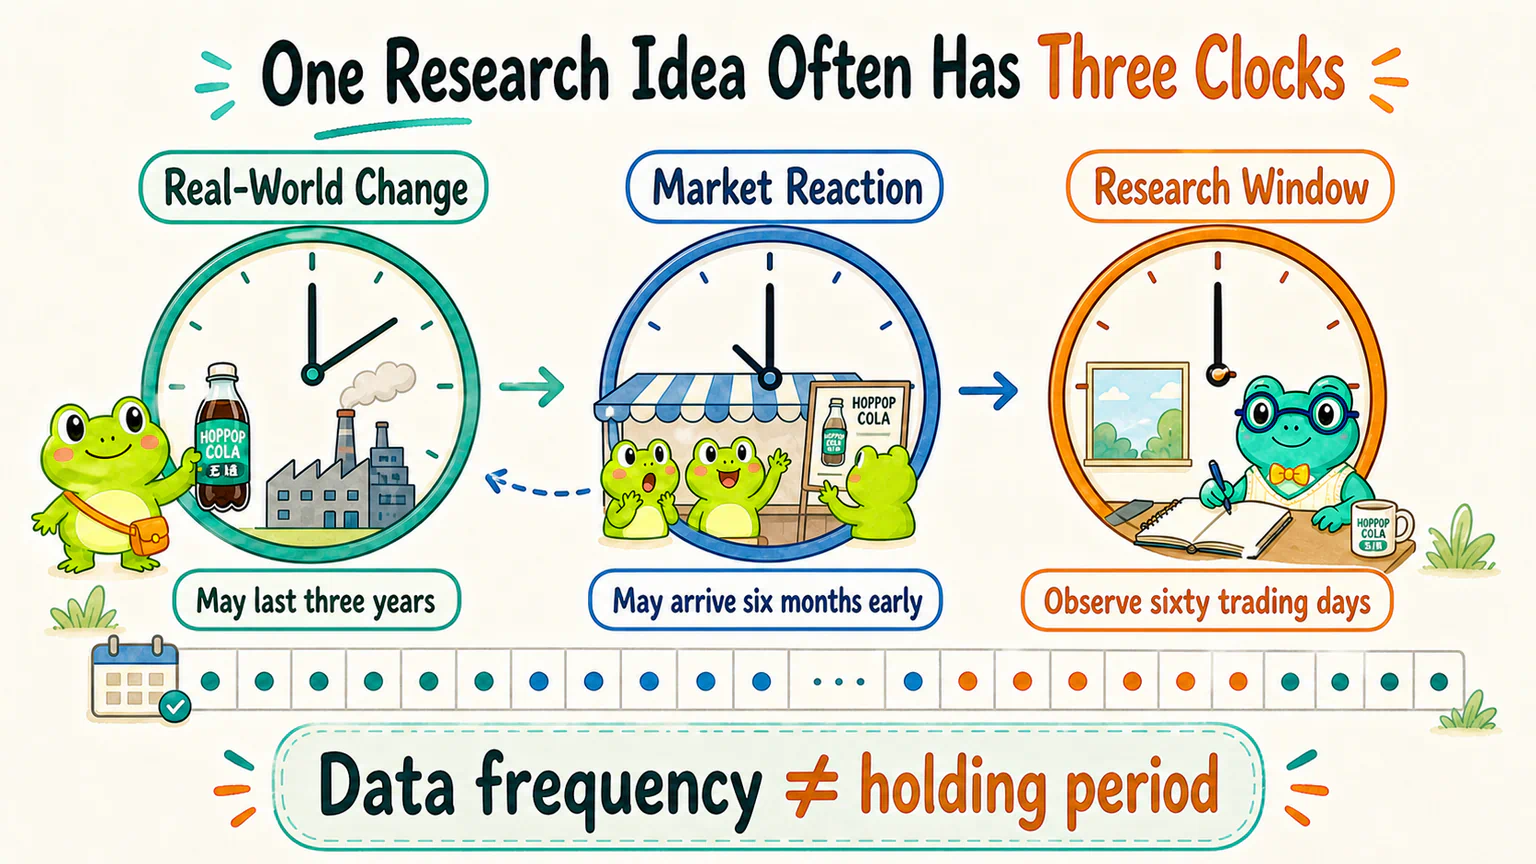
And a single research idea often contains three different clocks.
Imagine that HopPop Cola plans to build a new production line for sugar-free drinks.
The first clock hangs in the real world. Consumers may take years to change their tastes. The new line must go through approvals, purchasing, installation, and trial production. Opening a spreadsheet does not make the factory skip to the ending.
The second clock hangs in the market. The share price may move as soon as the plan is announced. Or investors may remain skeptical until sales actually improve. Price can run ahead while the real-world change is still unfinished, or reality can change before price fully catches up.
The third clock belongs to the researcher. They must choose when to start observing, whether to check the result after sixty trading days or after a year, and how long they will wait before admitting that the original idea may not be unfolding as expected.
The three clocks do not have to agree.
An industry shift may last three years. The market may start trading that expectation six months early. The researcher may look only at returns over the next sixty trading days.
This is also where people often make a simple mistake: using daily data does not mean you can study only short-term trading.
Daily data simply records one observation per trading day. More than two hundred daily observations can describe roughly a year. Several years of daily data can help us study much longer patterns.
How often the data is recorded and how long an idea is observed or held are two different questions.
Question Three: How Will It Find and Check Evidence?
Suppose three researchers all want to know whether growing demand for sugar-free drinks could create an opportunity for HopPop Cola.
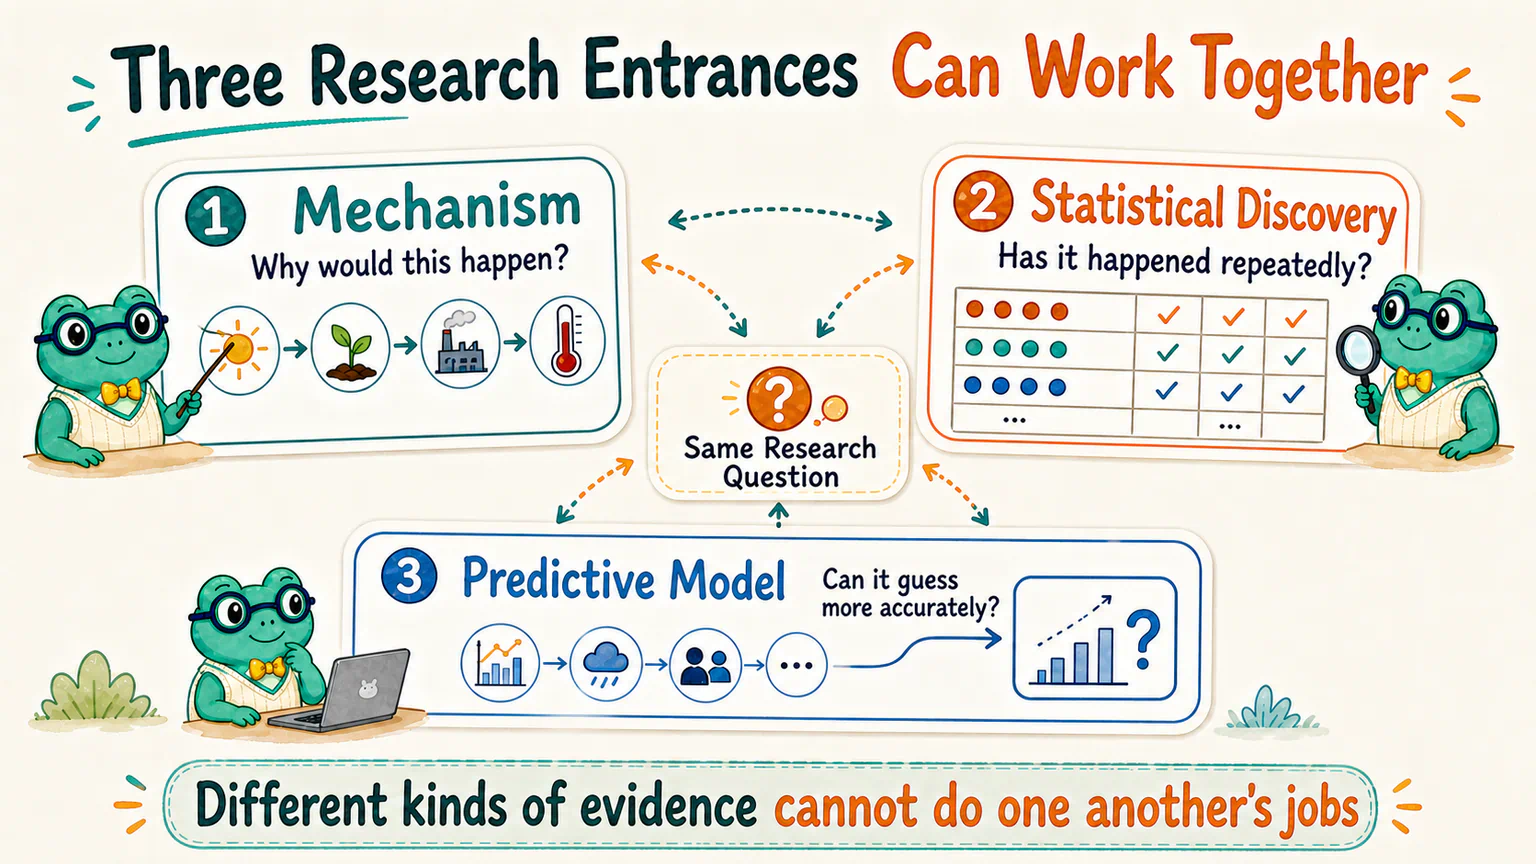
The first takes out a pen and draws a path. A shift in consumer taste may increase sales. Sales volume and pricing affect revenue. Revenue, costs, and competition then affect profit and market expectations.
This researcher begins with: Why would this happen?
That approach starts from a real-world mechanism. Its strength is that every step has a meaning. Its weakness is that even a beautifully connected story may still be only a story.
The second researcher opens a historical dataset. Instead of adding more to the story, they first define “growing demand,” decide which companies to observe and for how long, and compare whether similar situations appeared repeatedly in the past.
This researcher begins with: Has this happened again and again before?
Statistical comparisons can expose conclusions built from a few memorable examples. But a repeating shape in the data does not tell us its cause, and testing too many variations can produce a beautiful result by accident.
The third researcher feeds company, industry, and price information into a model and asks it to estimate what happens next.
This researcher begins with: Given this information, can we make a better prediction?
A predictive model can work with many clues, but it may look impressive on old data and fail in a different period. Even an accurate prediction does not prove that we understand the real cause.
The three researchers do not need another tournament.
The first can use a mechanism to suggest a hypothesis. The second can use statistics to check whether the pattern appeared repeatedly. The third can ask whether adding more information improves prediction. The order can also run the other way: someone may find a pattern in data first, then go looking for an explanation.
One asks why. One checks whether it happened repeatedly. One asks whether we can predict better.
They can work together, but they cannot sit one another’s exams.
So Where Do Technical Indicators, Python, and AI Fit?
Hoppy pointed at the candlestick chart on the desk. “What about technical indicators?”
A technical indicator usually rearranges price, volume, or other market records according to a formula. It can become part of statistical or rule-based research. But calculating an indicator does not automatically calculate the source of an advantage.
Python can help us clean data, run rules, and produce results. AI can help us discuss a hypothesis, write code, and investigate errors.
Both are useful. Neither can answer the first two questions for us.
“I used AI” does not explain why a pattern might exist in the market. “I wrote Python” does not tell us how long that pattern may take to appear.
Tools shape how we work. They do not automatically explain why the research might work.
Put the Map on One Card
We can now use the same card to describe any investment approach:
What does it mainly observe?

Where might the advantage come from?
How long is it prepared to wait?
How does it mainly find and check evidence?

What is it most likely to miss?
The middle three questions are the formal coordinates.
The first line tells us the scope. The last reminds us to look for blind spots. They are like the title and warning sign on a map, so they do not need to become two more dimensions.
The card gives no score and does not automatically choose the best strategy. It simply asks an approach to explain itself clearly.
Hoppy tried writing this on the first line:
A cheap price.
Then he noticed all the empty space below it.
Cheap compared with what? Why might the market have set the wrong price? How long are we prepared to wait? Will we check the idea through a business mechanism, a statistical comparison, or something else? What if the company itself is getting worse?
A sentence that had sounded complete turned back into a set of questions.
That is exactly what the map is for.
Next, we will take it with us and see where the familiar idea of “buying something cheap” sits on the map.
References
Sources checked on August 11, 2026
- CFA Institute, “Active Equity Investing: Strategies”, used to check that active equity research can be classified in several ways—including fundamental, quantitative, value, growth, momentum, top-down, and bottom-up—and that a quantitative process typically includes a thesis, data preparation, backtesting, evaluation, and attention to costs;
- Eugene F. Fama and Kenneth R. French, “Common Risk Factors in the Returns on Stocks and Bonds”, used for the classic research background on common risk factors and average returns; this lesson lists risk compensation only as a candidate explanation and does not claim that risk explains every observed pattern;
- Werner F. M. De Bondt and Richard Thaler, “Does the Stock Market Overreact?”, used for the classic empirical background on market overreaction as a testable hypothesis; its historical results are not treated as automatically transferable to A-shares or future periods;
- Galit Shmueli, “To Explain or to Predict?”, used to check that explanatory and predictive modeling have different goals and evaluation priorities, and that predictive ability does not automatically provide a causal explanation;
- China Securities Regulatory Commission, “Measures for the Operation of Publicly Offered Securities Investment Funds” (Chinese), used to illustrate that institutions in a real market may face rules involving investment scope, portfolio proportions, and liquidity; rules can change and must be checked again in real research.
HopPop Cola, all price changes, researchers, and coordinate entries are fictional teaching examples. The three-dimensional map is a course tool, not the only academic classification, a strategy scoring system, or a promise of returns. Nothing in this lesson is investment advice.
Lesson discussion
Share a question, insight, or different view—and see how other learners are thinking.