Lesson 4
Does a Great Industry and a Great Company Make a Great Stock?
Separate industry growth, company growth, and stock returns, then place one typical growth and industry-trend path on the three-dimensional map.
The previous route began by comparing a company’s possible value with its current price.
Another group of investors prefers to look toward the future first. They often begin with two questions: Will this market become much larger? Which companies can actually capture that opportunity?
People who focus on a company’s future expansion are often called growth investors. Those who begin with changing demand, new technology, or an expanding industry are often described as industry-trend researchers. The two labels overlap, but they do not describe one fixed method.
Some researchers find a promising industry first, then look for companies inside it. Others discover an unusual company first, then ask whether its market is large enough to support years of growth.
Once again, the labels are road signs, not uniforms.
Hoppy happened to find a report that pointed down this route.
Its headline said:
Demand for sugar-free drinks may continue to grow over the next five years.
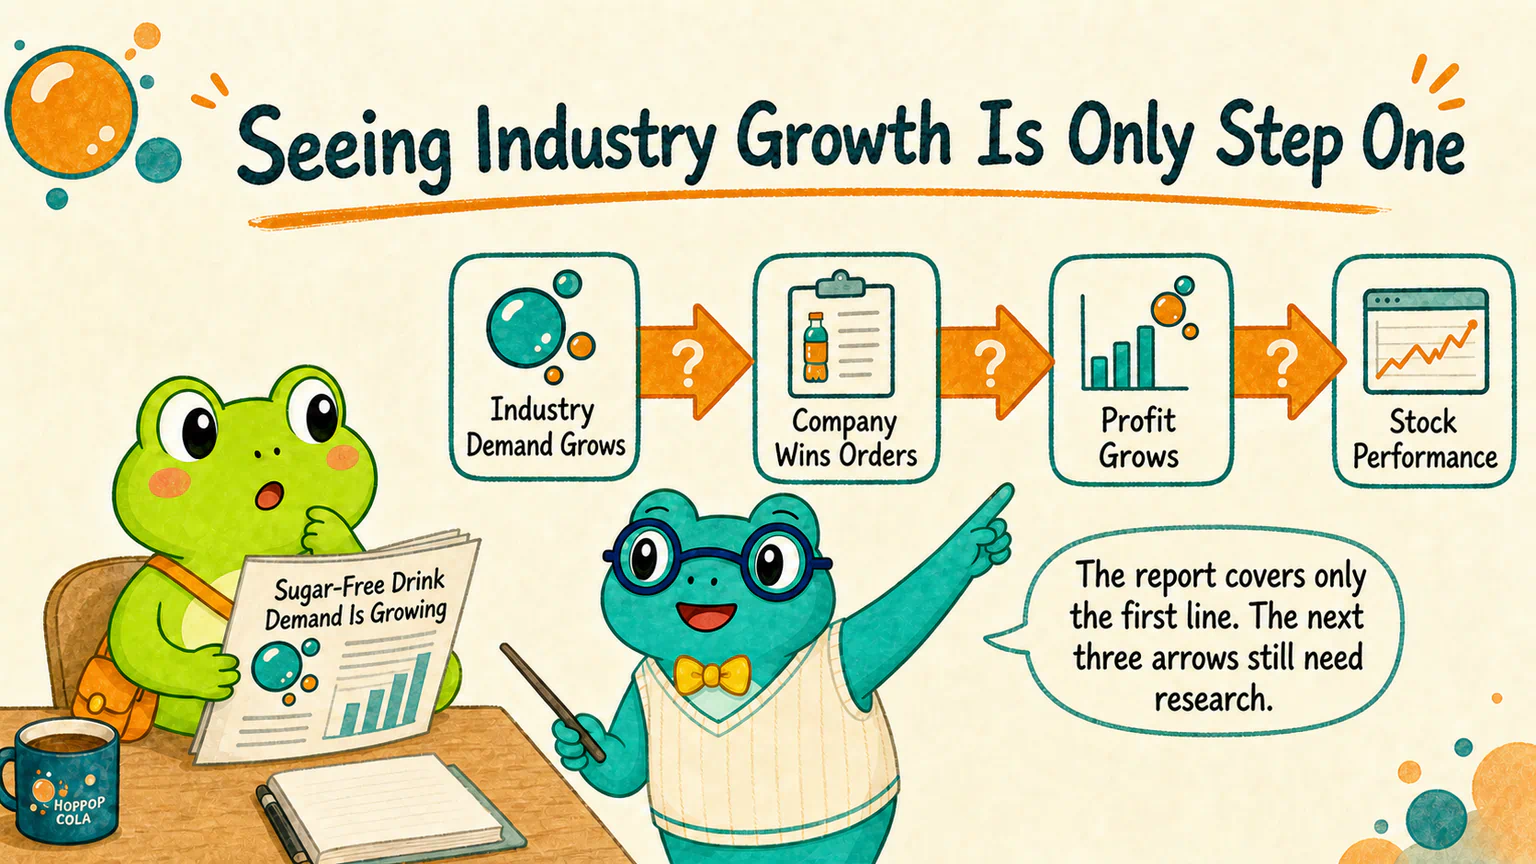
Underneath, Hoppy drew three arrows:
Industry demand grows
→ HopPop Cola wins more orders
→ Company profit grows
→ The stock rises
Then he closed the report, looking pleased with himself.
Dr. Hop reopened the report and circled the three arrows.
The report discussed only the first line. You added the other three yourself.
This course uses China’s A-share market as its main source of data and market-rule examples. Disclosure systems, trading rules, available datasets, and investor behavior differ across markets. Those details must be checked in the market you actually study, but the research logic in this lesson travels well: industry growth, company growth, and stock performance are separate links everywhere.
A Growing Industry Is Only the First Step
Industry-trend research does not begin with a silly question.
Consumers may start avoiding sugary drinks. New technology may lower production costs. Policy may change product standards. A new use case may create demand that did not exist before. Any of these changes could make a market larger.
But a larger cake is not divided equally among every company sitting at the table.
Imagine a fictional drink market that sells 100 cases a year. HopPop Cola sells 20 of them. Later, the market expands to 150 cases, but more competitors arrive and HopPop’s share falls from 20% to 10%.
The industry grew. HopPop now sells only 15 cases—fewer than the 20 it sold before.
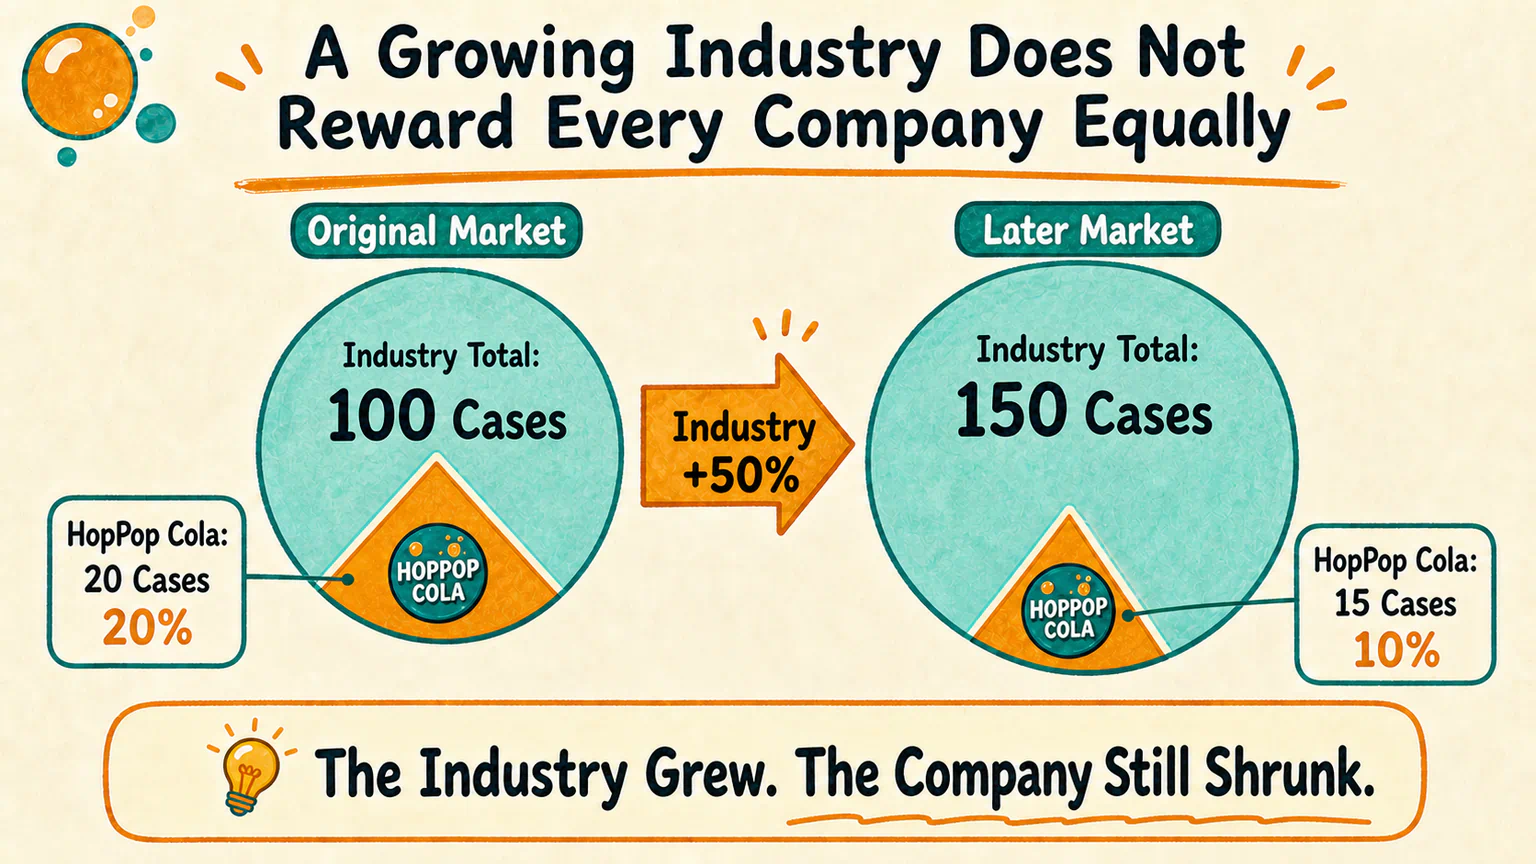
This does not make the industry trend useless. It means the trend answered only the first part of the question.
To connect the opportunity to one company, we still need to ask whether its product fits the new demand, whether it can expand production, whether its distribution is strong enough, whether its brand can defend its prices, whether competitors will move faster, and whether management can turn a plan into real operations.
Even higher sales do not guarantee higher profit.
HopPop might offer deep discounts to win customers. It might need to build an expensive new factory first. Ingredient, shipping, and marketing costs might rise. Selling more bottles while earning less on each bottle can produce rising revenue and falling profit at the same time.
So the journey from an industry trend to a stock requires several more answers:
Is the market really becoming larger?
How much of that growth can this company capture?
What will the company have to spend to capture it?
How much profit and cash will remain at the end?
The more popular a trend becomes, the more companies usually arrive hoping for a slice.
A Growing Company Can Still Disappoint the Stock Market
Suppose Hoppy checks every arrow so far.
Demand for sugar-free drinks really is rising. HopPop has sold more bottles. Its profit is up 30% from last year.
That sounds like straightforward good news.
But what if the market had expected profit to grow by 50%?
The company still grew. It simply did not grow as much as investors had already imagined. If the share price carried a very optimistic future before the result arrived, the stock may still disappoint.
Now consider another company that was expected to grow by only 5% but actually grew by 15%. Its absolute growth rate is lower, yet its result is better than the earlier expectation.
This does not mean prices always react in one predictable way. It points to a more useful lesson: the market is not judging growth in isolation. It is also comparing what actually happened with what investors had already priced in.
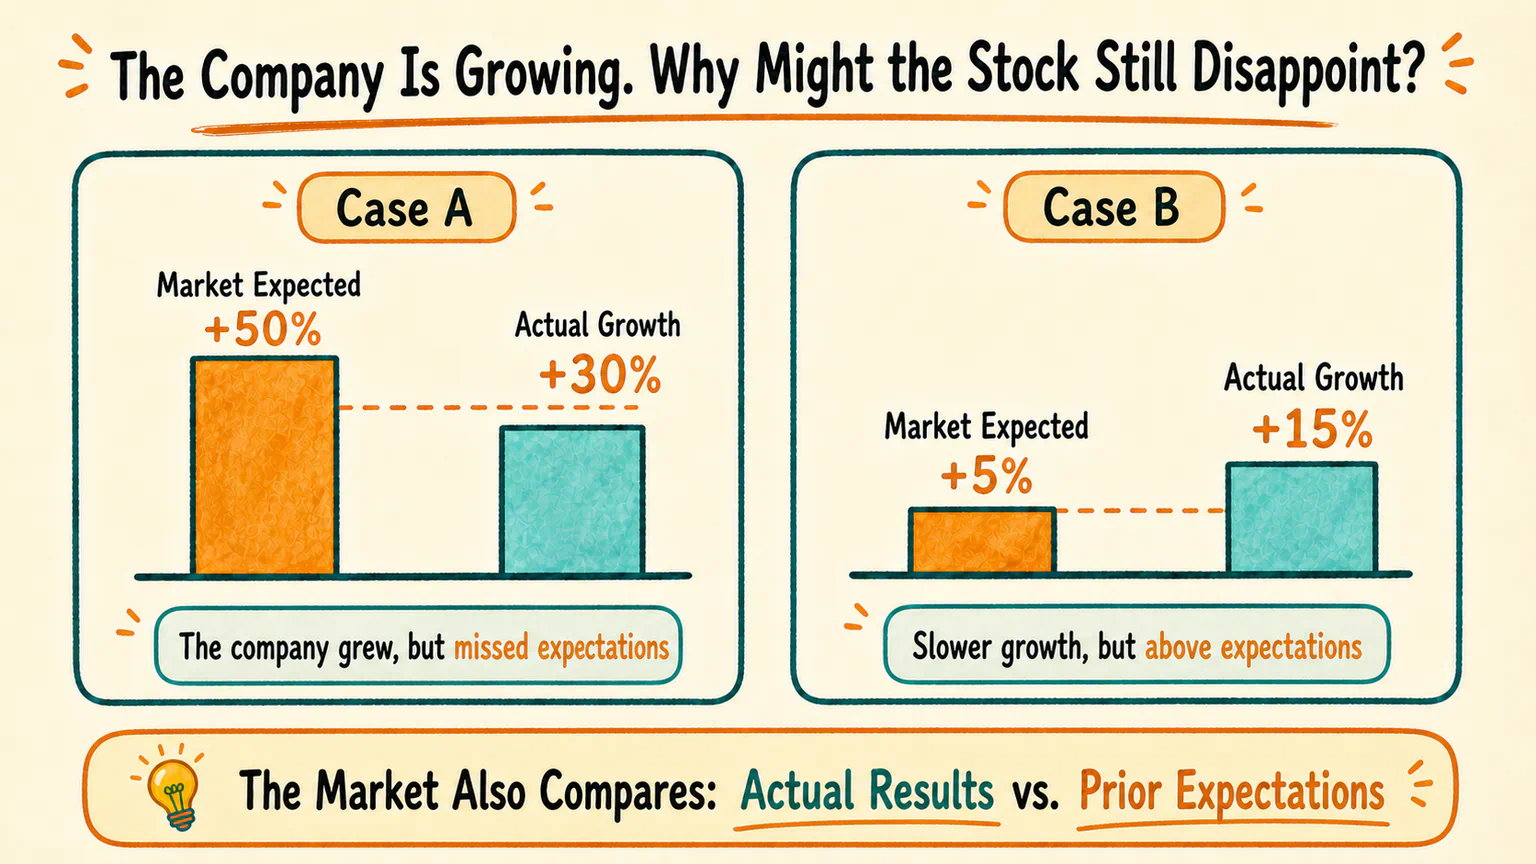
That is why a good industry, a good company, and a good stock are related but different judgments.
A good industry may contain many ordinary businesses. A good company may already carry enormous expectations. Even if you are right about the direction of growth, paying too high a price can mean paying for years of that growth in advance.
Growth research does not end when it finds growth. It asks where the growth comes from, how long it can last, how much investment the company must make, how competition may change, and how impressive a future the current price already demands.
Growth Research Has More Than One Path
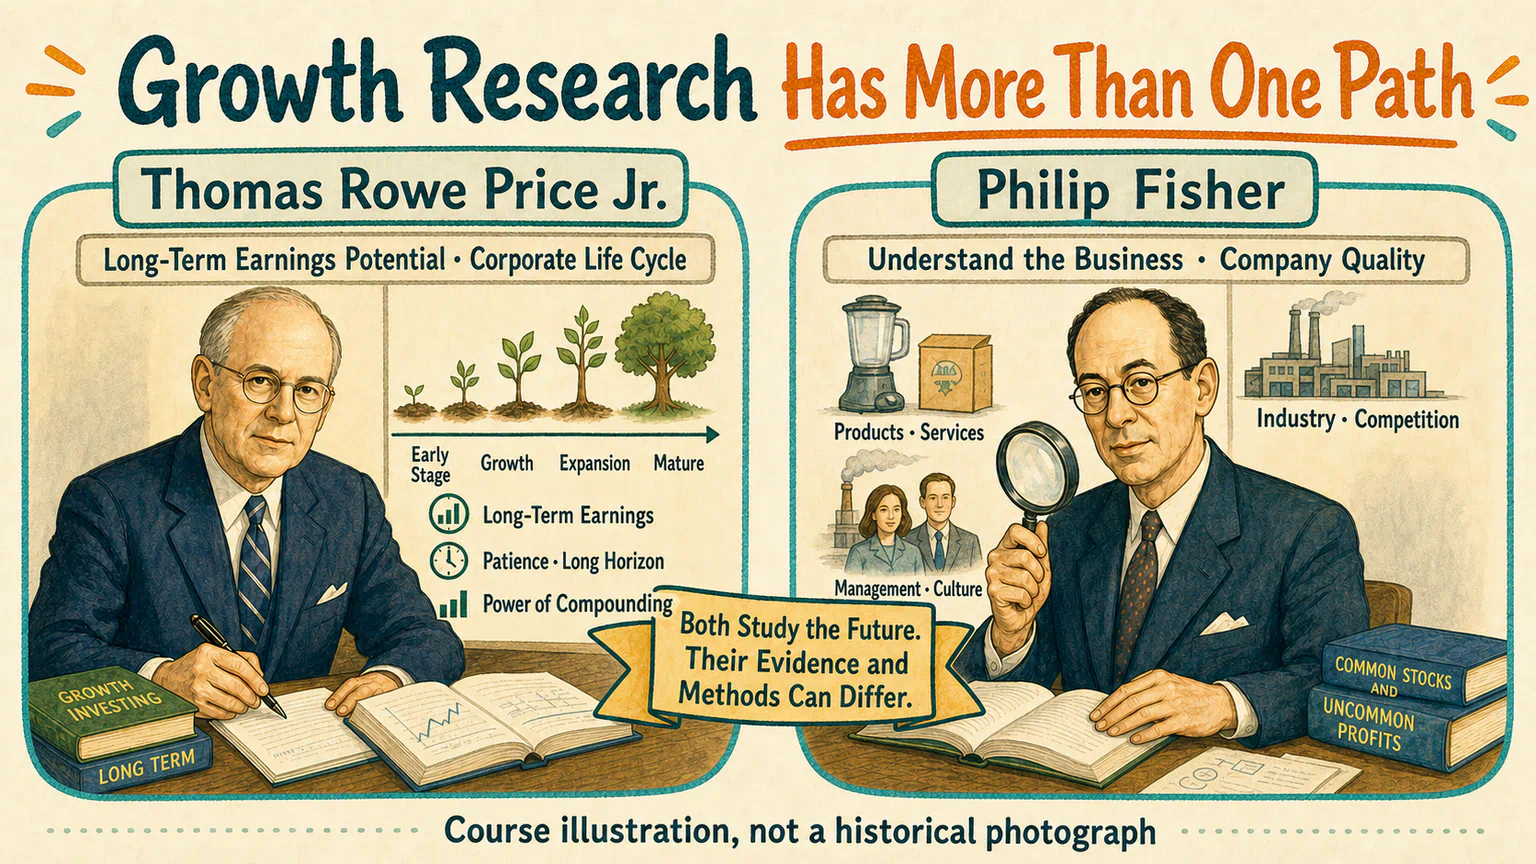
Thomas Rowe Price Jr. founded the investment firm that bears his name in 1937. His early work emphasized companies with long-term earnings potential and extended fundamental research across different stages of a company’s life cycle.
Philip Fisher placed more emphasis on deeply understanding how a business operated, whether its products and management were exceptional, and whether its ability to grow could last. He developed these ideas in Common Stocks and Uncommon Profits, first published in 1958.
Both belong in the history of growth investing, but they were not copies of the same template.
Under one broad label, one researcher may focus more on corporate life cycles and long-term earnings. Another may focus more on business quality, competitive strength, and first-hand knowledge of a company. Modern growth research can begin with an industry theme, begin with one company, or use statistical methods to compare sales, earnings, and research spending across hundreds of firms.
These figures are not here to endorse whatever industry happens to be popular today. They make the opposite point: growth research tries to understand how a company can turn a possible future into operating results. An upward-sloping industry chart is not the end of the work.
Put Growth and Industry Trends on the Three-Dimensional Map
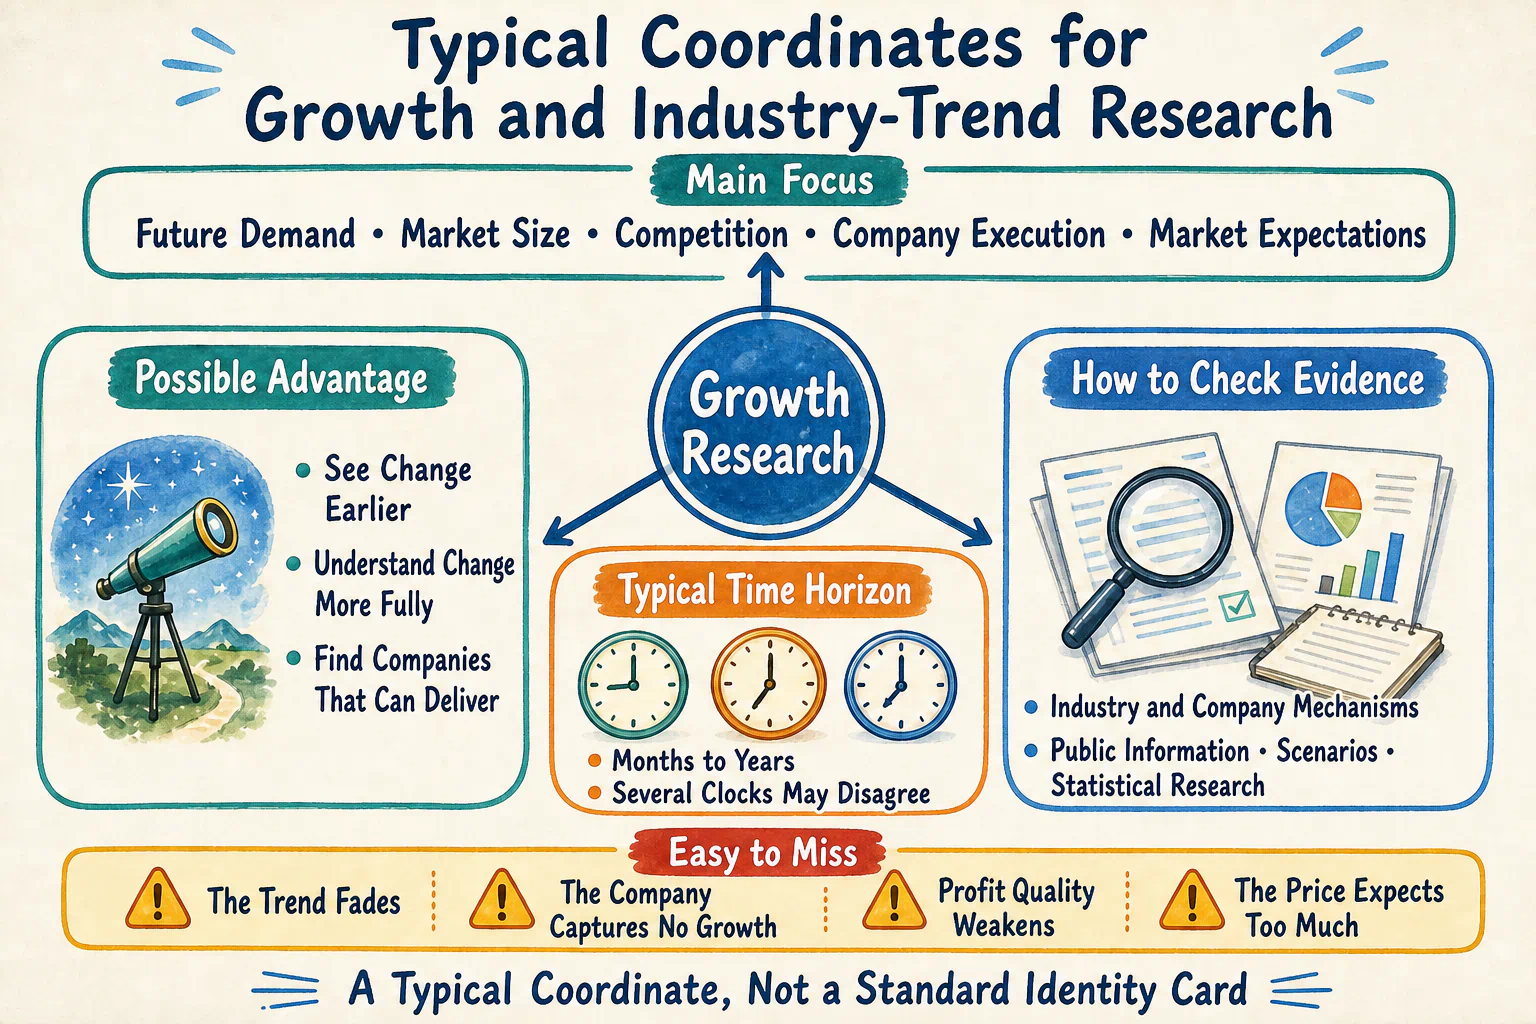
We can now place one typical form of growth and industry-trend research on our map.
What does it mainly observe?
Future demand, market size, technological and policy change, competition, and the company’s products, capacity, distribution, earning power, and current market expectations.
Where might its advantage come from?
A researcher may notice a change earlier than others. They may understand more clearly how long it could last and which companies can truly capture it. The advantage might also come from recognizing that the market has overestimated a popular story—and avoiding the companies that cannot deliver.
“I can see the big trend” is still only a starting point. If everyone else can see it too, and the price already reflects it, the observation may no longer offer an advantage.
How long is it prepared to wait?
Industry and company growth often unfold over months or years. But the industry, a company’s factory expansion, its eventual profit, and the market’s changing expectations all run on different clocks.
Researchers also need to define their own observation window. Otherwise, whenever the growth fails to appear, they can simply move the story farther into the future.
How does it find and test evidence?
The research may begin with mechanisms involving demand, products, competition, and business operations, then combine public information, company data, industry indexes, and scenario analysis. It can also turn claims such as “the industry is growing” and “the company can capture it” into data conditions, then use statistical research to ask whether similar cases have repeatedly behaved as expected.
A typical coordinate might look like this:
Main focus: future demand, market size, competition,
the company’s ability to capture growth, and market expectations

Possible advantage: seeing a change earlier or understanding it more fully,
then finding the companies that can actually deliver
Typical time horizon: months to years, while several clocks may disagree
Main methods: industry and company mechanisms, public information,
scenario analysis, and possibly statistical research

Easy to miss: a trend that fades, a company that captures none of the growth,
weaker profit quality, or a price carrying expectations that are too high
This is a typical coordinate, not a standard identity card for every growth investor or industry-trend researcher.
The Smoothest Growth Line May Hide the Biggest Gap
Hoppy returned to the first page of the report.
It said demand might grow. It did not say every company would grow. It certainly did not say every related stock would rise.
Extending the last few years of rapid growth straight into the future, assigning the entire industry opportunity to one company, then turning company growth directly into stock returns produces a wonderfully smooth line. It may also skip several places where evidence is missing.
That is one way investors fall into a growth trap: the company’s story may be attractive and some growth may be real, but its duration, profit quality, or the market’s earlier expectations were far too optimistic.
An industry focus and a long horizon form one useful combination on the map. They are not the required answer for every investor. What matters is not announcing that you can see far into the future. What matters is explaining how each arrow could hold—and where it could break.
Next Stop: Follow a Direction Already Under Way
Hoppy did not delete his growth chain.
He simply added a question mark to each arrow.
Then he opened HopPop Cola’s price history and noticed that this fictional stock had already been rising for some time.
Another question appeared:
If it has already risen, am I too late to follow it now?
The next group of researchers will temporarily set aside the question “What should this company be worth?” and begin with the direction that prices have already taken.
References
Sources checked on August 12, 2026
- CFA Institute, “Active Equity Investing: Strategies”, used to check how growth, bottom-up, top-down, and quantitative approaches can overlap, and how fundamental investing can encounter a growth trap;
- T. Rowe Price, “About Us” and “US Equity Heritage”, used to check that Thomas Rowe Price Jr. founded the firm in 1937 and emphasized long-term earnings potential, fundamental research, and the corporate life cycle;
- Fisher Investments, “Books by Philip Fisher”, used to check Fisher’s place in growth-investing history and the first publication of Common Stocks and Uncommon Profits in 1958;
- Aswath Damodaran, “The Fundamental Determinants of Growth” and “Growth Companies: Value Drivers”, used to check the connections among company growth, reinvestment, competition, market opportunity, and operating quality;
- CFA Institute, “Economic Growth”, used to check that stock prices reflect expectations about future earnings and economic activity; this lesson does not treat economic growth as a direct promise of individual-stock returns.
HopPop Cola, the sugar-free-drink report, market sizes, growth rates, expectations, and all company outcomes are fictional teaching examples. This lesson introduces one typical location for growth and industry-trend research and provides no stock-picking method or investment advice.
Lesson discussion
Share a question, insight, or different view—and see how other learners are thinking.