Lesson 7
Is Quant Really an Investment School?
Separate investment logic from research method and see how quant can span different advantage sources, time horizons, and evidence paths.
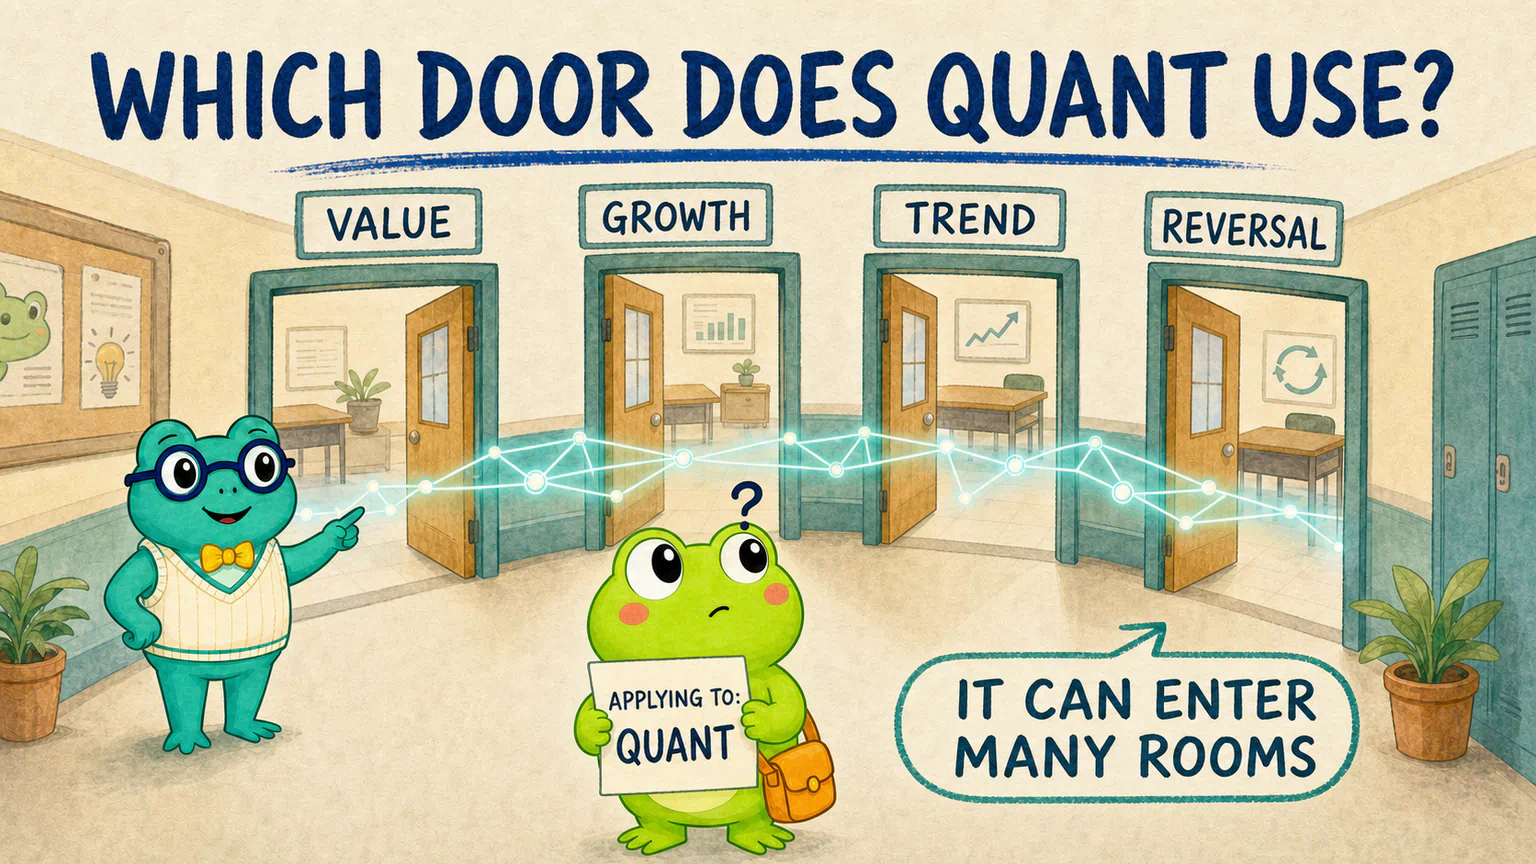
After visiting value, growth, trend, and reversal research, Hoppy decided it was finally time to pick a camp.
He opened a blank document and carefully typed:
Application
Name: Hoppy
Applying to join: the quant camp
Reason: It sounds scientific, and I will not have to choose among the other four.
Dr. Hop neither approved nor rejected it. He simply added one question underneath:
Hoppy thought for a long time.
An inexpensive company can be studied with data. So can a growing industry. Researchers can measure whether a price direction tends to continue. They can also measure whether an extreme move tends to reverse.
If all four routes can use quantitative research, then “quant” does not look much like a fifth private classroom.
It looks more like a way of doing research that can enter many classrooms.
The Same Quantitative Approach Can Begin with Very Different Questions
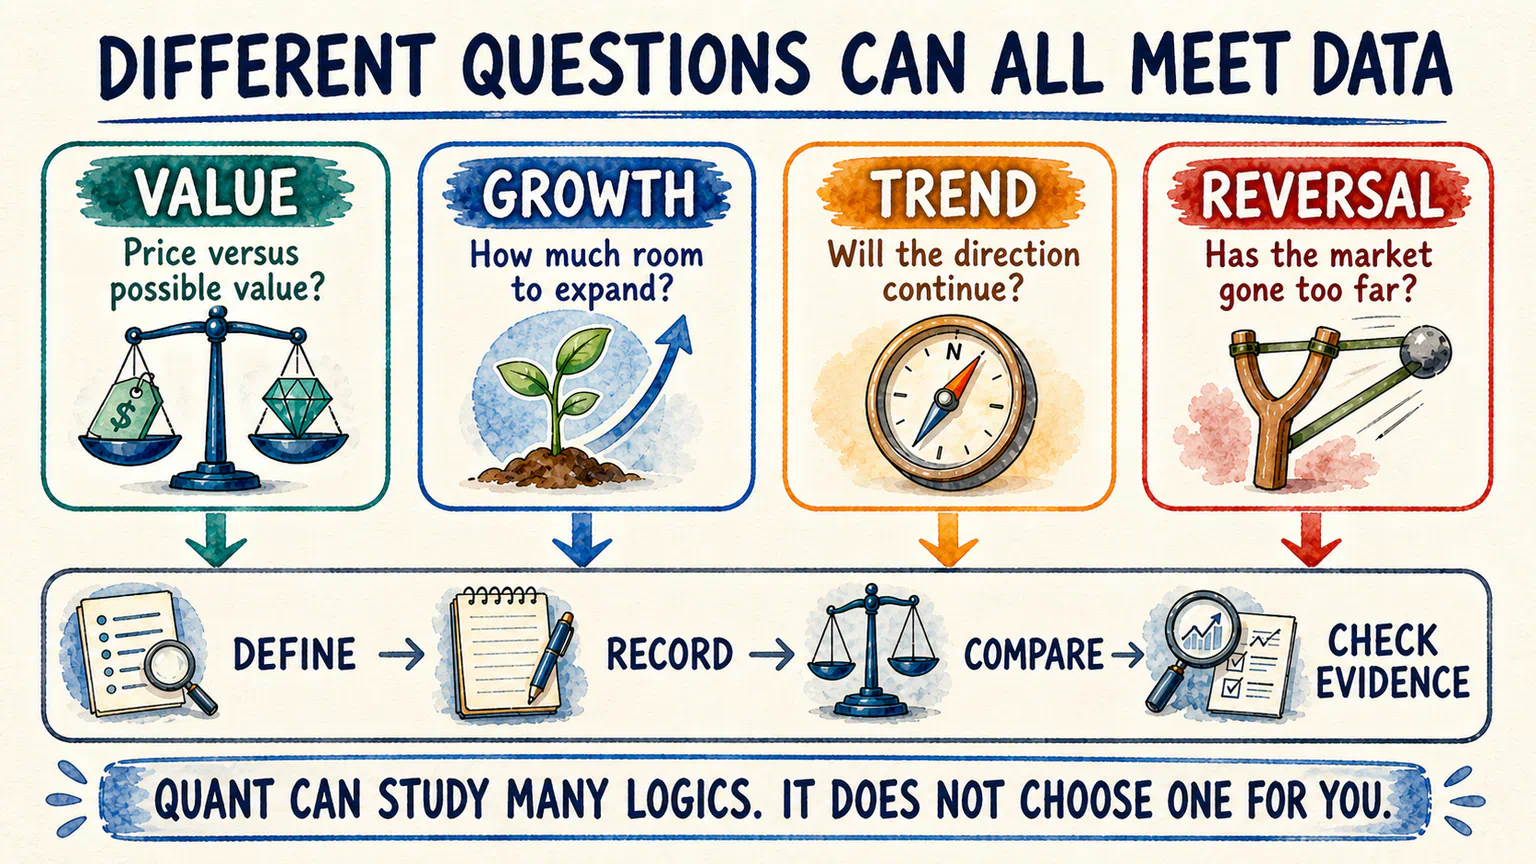
Let us put the four routes we have visited onto four notes:
Value: Is the price low relative to possible value?
Growth: How much room do the market and company have to expand?
Trend: Will an existing price direction continue?
Reversal: Has the market already gone too far?
They do not believe the same thing. They may not even wait on the same clock.
Yet every note can be followed by the same kinds of questions:
- What exactly do you mean by “cheap,” “growth,” “trend,” or “too far”?
- What usually happened later to historical cases that met your description?
- Does the result survive a different period, market, or definition?
- Are you willing to accept that the data may not support your original intuition?
These questions do not declare a winner. They make an intuition more explicit and easier to inspect.
That is why quantitative value, quantitative growth, quantitative trend, and quantitative reversal research can all exist.
“Quantitative” tells us something about how we treat a question. It does not choose the question for us.
Quant First Changes How We Handle a Question
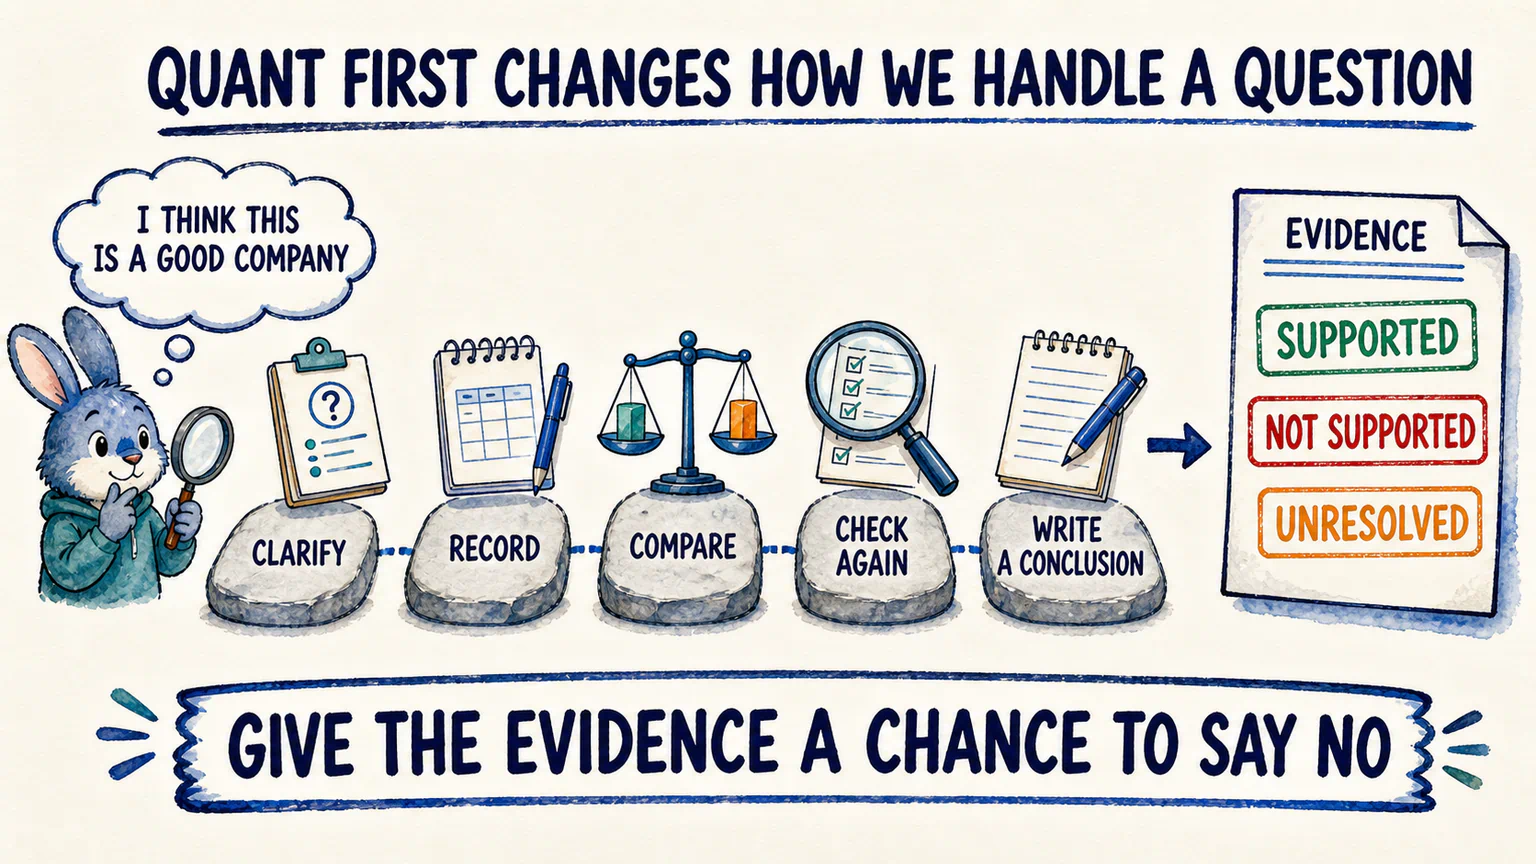
“I think this is a good company.”
That is a real opinion, but it is still difficult to inspect. Does “good” mean strong products, high profits, a large future market, or a low price? Is the company good now, or might it become good over the next three years?
Quantitative research does not immediately stamp the sentence “right” or “wrong.” It pushes the researcher through several steps:
Clarify vague words
Keep a record of what will be observed
Make comparable cases comparable
Apply the same rules repeatedly
Write a current conclusion from the evidence
The point is not to force every question into one beautiful number.
The point is that a researcher should not quietly change the meaning of “good” after seeing the result, or keep only the examples that support the story.
Quantitative work can make a question easier to repeat and inspect. It can also make it easier for someone else to find problems in our definitions, data, or reasoning.
Quantitative research is not a machine for finding proof for “I think.” One of its most useful jobs is to give the evidence a fair chance to say no.
Of course, computable does not mean correct.
We could define a “good company” as “a company with a long name.” That definition is easy to calculate. A program could process it quickly and produce polished charts, but it may have little to do with the question we actually wanted to study.
Definitions can be poor. Data can be missing. Comparisons can be unfair. A historical result can be accidental.
Quantitative methods can make mistakes easier to expose. They do not make mistakes disappear.
Knowing Python Does Not Mean You Already Know Quantitative Research
Hoppy scrolled down his application and added four more qualifications:
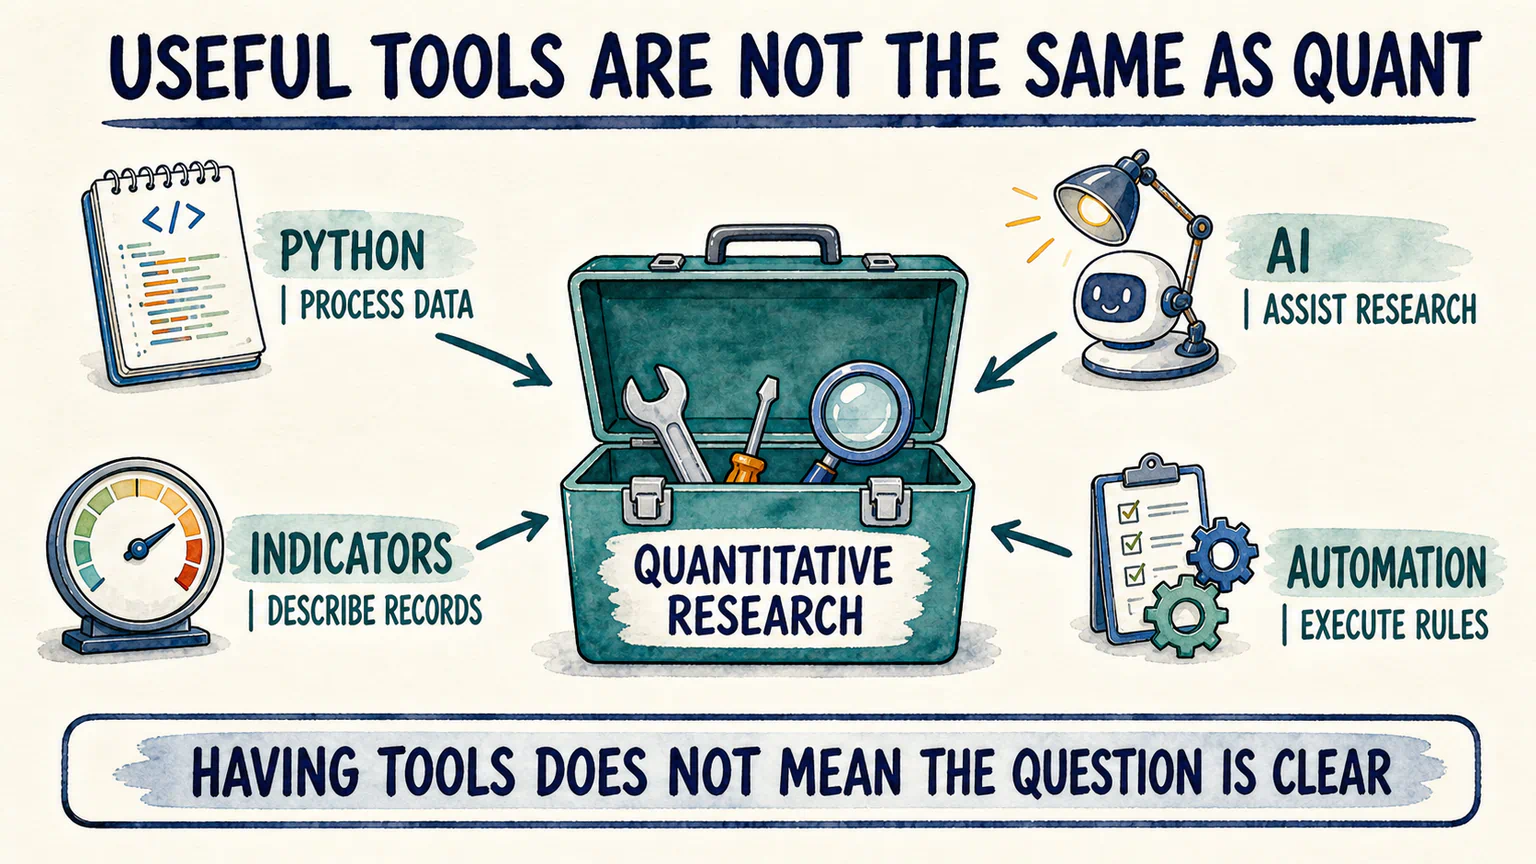
Can ask AI to write code
Has Python installed
Can display technical indicators
May automate orders someday
Surely that would settle it.
But none of the four points explained which pattern he believed in or how he planned to check it.
Python can process large amounts of data. It can also execute a bad definition with impressive efficiency.
AI can help write programs, investigate problems, and organize results. It can also misunderstand the task or confidently fill in conditions that the researcher never defined.
A technical indicator can compress a price record into a number. Seeing that number on a screen does not prove that it predicts anything.
Automated trading can follow a rule. A rule being executable does not make it worth executing.
All four tools can be useful. We will use some of them later in this course.
But they belong in the toolbox. None of them, by itself, is quantitative research.
Pretty much. AI may help chop the vegetables, too, but it should not quietly decide whether the pot needs a pinch of salt or the entire bag of sugar.
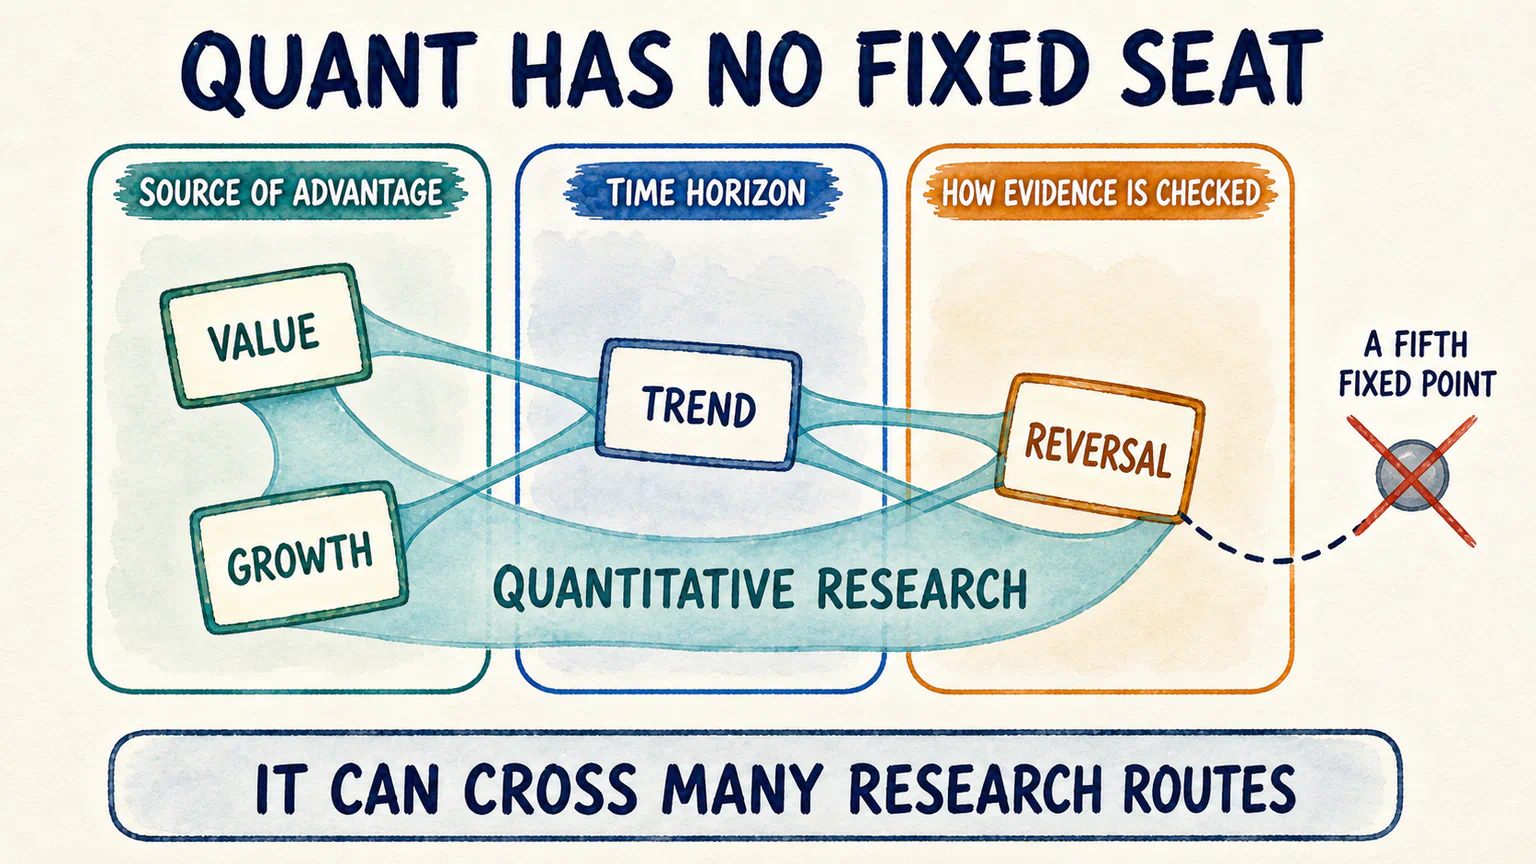
Quant Does Not Have One Fixed Seat on the Three-Dimensional Map
Return to the three questions we have used throughout this unit:
Where might the advantage come from?
How long are you prepared to wait?
How will you look for and inspect evidence?
A value study may explain a possible advantage through a gap between price and value. A trend study may look to slow reactions or staged trading. A reversal study may focus on overreaction and temporary price pressure.
In other words, the possible source of advantage still comes from the specific research logic.
Whether the researcher waits days, months, or years also depends on how the proposed pattern is supposed to unfold. Quantitative work does not turn every idea into short-term trading.
There is no single way to look for evidence, either.
A researcher may begin with an economic mechanism and translate a real-world causal story into an inspectable question. Another may begin by looking for a recurring statistical pattern. A third may combine many inputs in a prediction model and test how it behaves on new data.
The approaches can work together, and each can fail in its own way. Quantitative research does not occupy only one of them.
Instead of drawing “quant” as a fifth dot beside the map, imagine it as an inspection net. The net can stretch across different advantage stories, time horizons, and research methods, asking each idea to leave clearer definitions and evidence behind.
The Map Is Not Complete—and You Do Not Need to Pick a Side
This unit visited only a few routes that are easy to recognize.
You will also encounter labels such as event-driven, macro, arbitrage, factor investing, high-frequency trading, and machine-learning prediction. They can overlap, combine, and even mean different things to different people.
We do not need an encyclopedia here.
When you encounter a new label, begin with three sentences:
Where might its advantage come from?
How long does it plan to wait or observe?
How does it mainly look for and inspect evidence?
Answering those questions means we have roughly located a research route. It does not give us a complete strategy, and it does not prove the route will make money.
You do not need to pledge loyalty to one camp. Someone may begin with a change in an industry and then use statistical evidence to inspect the idea. Someone else may find a pattern in data and then return to the real world to look for a mechanism.
Researchers may also care about management, culture, institutions, or other information that is difficult to reduce to a clean number. Those materials do not become worthless because they do not fit neatly into a table. Quantitative research is useful; it is not a demand that every meaningful question surrender to numbers.
This course uses China’s A-share market as its shared source of examples and, later, data. Market rules and implementation details differ around the world, but the distinction in this chapter travels well: an investment idea chooses what it believes, while quantitative research helps define and inspect that belief.
Next: What Are We Actually Quantifying?
Hoppy crossed “join the quant camp” off his application and wrote a different sentence:
I think an industry is becoming more important, and its good companies may perform better over the long run.
The sentence points toward a research direction, but it still contains many blanks.
What does “more important” mean? How will we recognize a “good company”? How long is “the long run”? Better than what?
Adding “please verify this with Python” to the end of the sentence will not fill those blanks.
We now know how to ask what different investment routes care about. The next step is to answer a more precise question: when we say we are doing quantitative research, what exactly are we quantifying? How does an ordinary sentence become a question that data can support, reject, or leave unresolved?
References
Sources checked on August 12, 2026
- Asness, Moskowitz, and Pedersen, “Value and Momentum Everywhere”, used to illustrate that value and momentum can both be examined within quantitative empirical research while remaining different investment logics;
- Gu, Kelly, and Xiu, “Empirical Asset Pricing via Machine Learning”, used to illustrate that prediction methods can process information related to price trends, liquidity, volatility, and valuation, while predictive measurement alone does not explain economic mechanisms.
HopPop Cola and Hoppy’s application to the ‘quant camp’ are fictional teaching devices. This chapter explains the relationship between quantitative research and investment logic. It does not provide a model, strategy, parameter set, backtest result, or investment advice.
Lesson discussion
Share a question, insight, or different view—and see how other learners are thinking.