Lesson 5
It Has Already Risen. Why Would Anyone Still Follow?
Separate an observed price direction from an untested continuation hypothesis, then locate one typical set of trend-following coordinates.
The previous two routes mainly looked for answers in businesses and the real world.
Value researchers ask whether today’s price sits far below what an investment may be worth. Growth and industry-trend researchers ask whether a market can become larger and which companies can actually capture that growth.
Another group begins with the trail the market has already left behind.
Their first question is: A price has moved in one direction for a while. Could that direction continue?
People often call this route “trend following.”
The name is still only a road sign. Trend following is not the whole of technical analysis, and it does not require everyone to use the same chart, indicator, or time period.
It certainly does not mean charging in whenever a price rises.
Hoppy had just found a chart that raised exactly this problem.
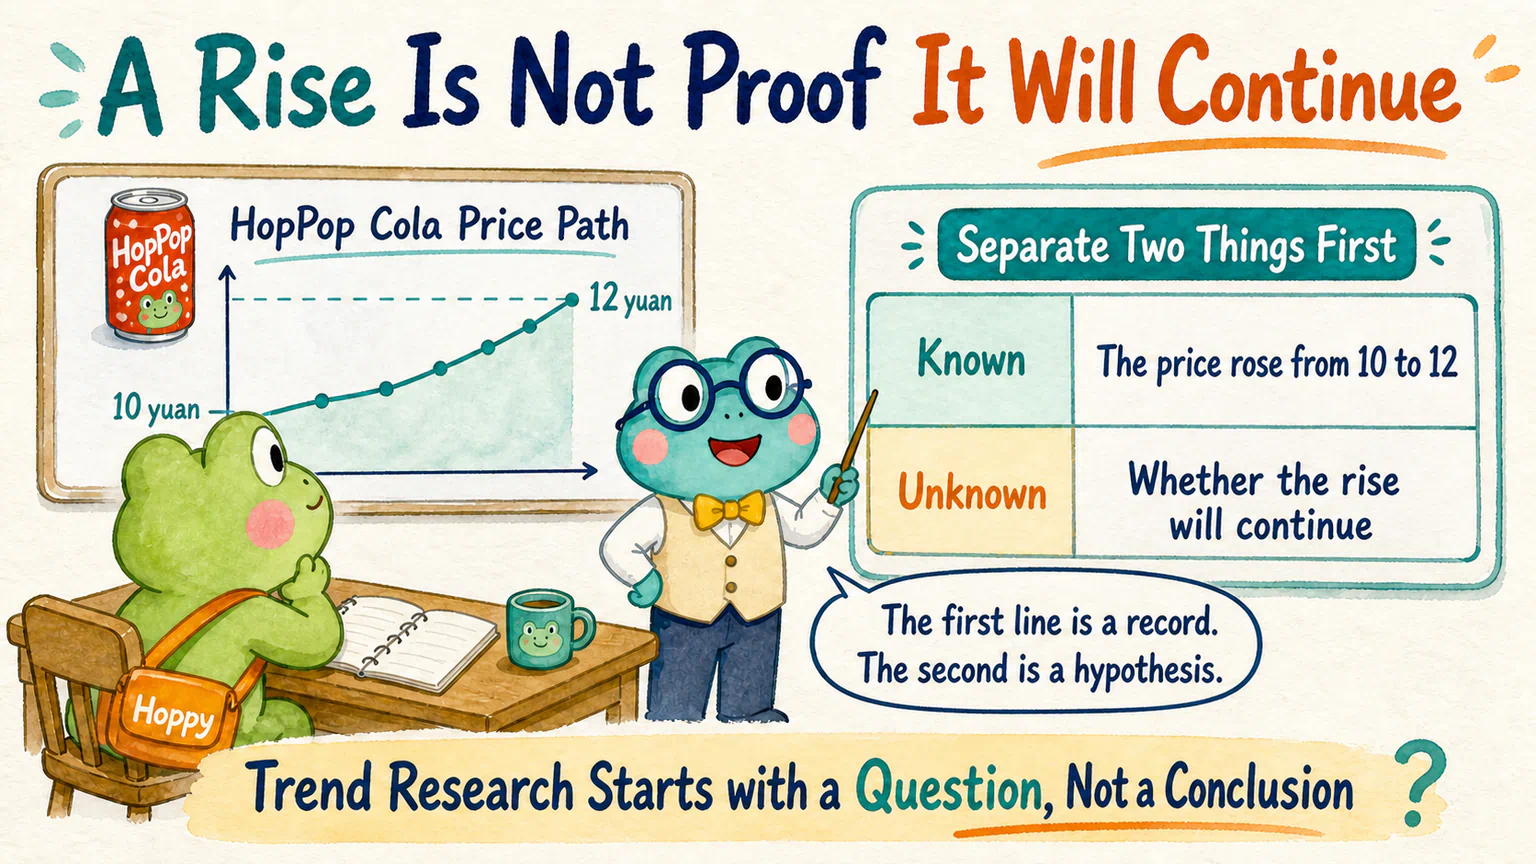
One month ago, the fictional share price of HopPop Cola was 10 yuan. Then it rose for a few days, paused for two, and rose again. By the time Hoppy noticed, the screen showed 12 yuan.
He moved the cursor toward the buy button, then quickly moved it away.
Dr. Hop did not tell him to buy or sell. He handed Hoppy a sheet of paper:
Known: the price rose from 10 yuan to 12 yuan
Unknown: whether this rise will continue
This course uses China’s A-share market as its main source of data and trading-rule examples. Trend questions can be studied in many markets, but price-limit rules, T+1 trading constraints, suspensions, adjusted-price conventions, liquidity, and trading costs can change the result. Those details must be rebuilt for the market you actually study.
A Price Move May Not Be Finished Yet
One natural reaction to a rising price is, “I am already too late.”
A trend researcher asks one more question: why must the market absorb every change in a single day?
Suppose something important really has changed at HopPop Cola. The first investors to read the news update their views. Others wait for more evidence. Some institutions need meetings, model revisions, and approval before they can act. Large investors may be unable to complete a trade all at once without moving the price against themselves.
One event can therefore enter the price through many people acting at different times.
Some changes do not even arrive as one clean announcement. Product sales improve month by month. Industry figures are released gradually. Competitors reveal their responses. The market’s understanding of the story may spread in stages.
These possibilities offer several candidate explanations for a continuing trend:
Not everyone understands the information at once
Investors revise their views at different times
Large positions must be built gradually
Attention and sentiment spread through the crowd
The important phrase is “candidate explanations,” not “permission to buy.”
The same rise might be a short burst of excitement, a crowded trade, or random movement. By the time Hoppy notices, everyone else may already have finished buying.
Trend following does not jump directly from “it rose” to “it will keep rising.” It offers a research hypothesis: under a clearly defined condition and time window, is an existing direction more likely to persist than we would expect from random movement alone?
That sounds less exciting than “winners keep winning.” It is also much easier to hand to data for inspection.
Without a Time Window, There Is No Single Trend
Hoppy zoomed the HopPop chart in and out.
Over the last five days, the price was falling.
Over the last three months, it was still moving upward.
Over the last two years, it may have done little more than wander through a broad range.
All three statements can be true at the same time.
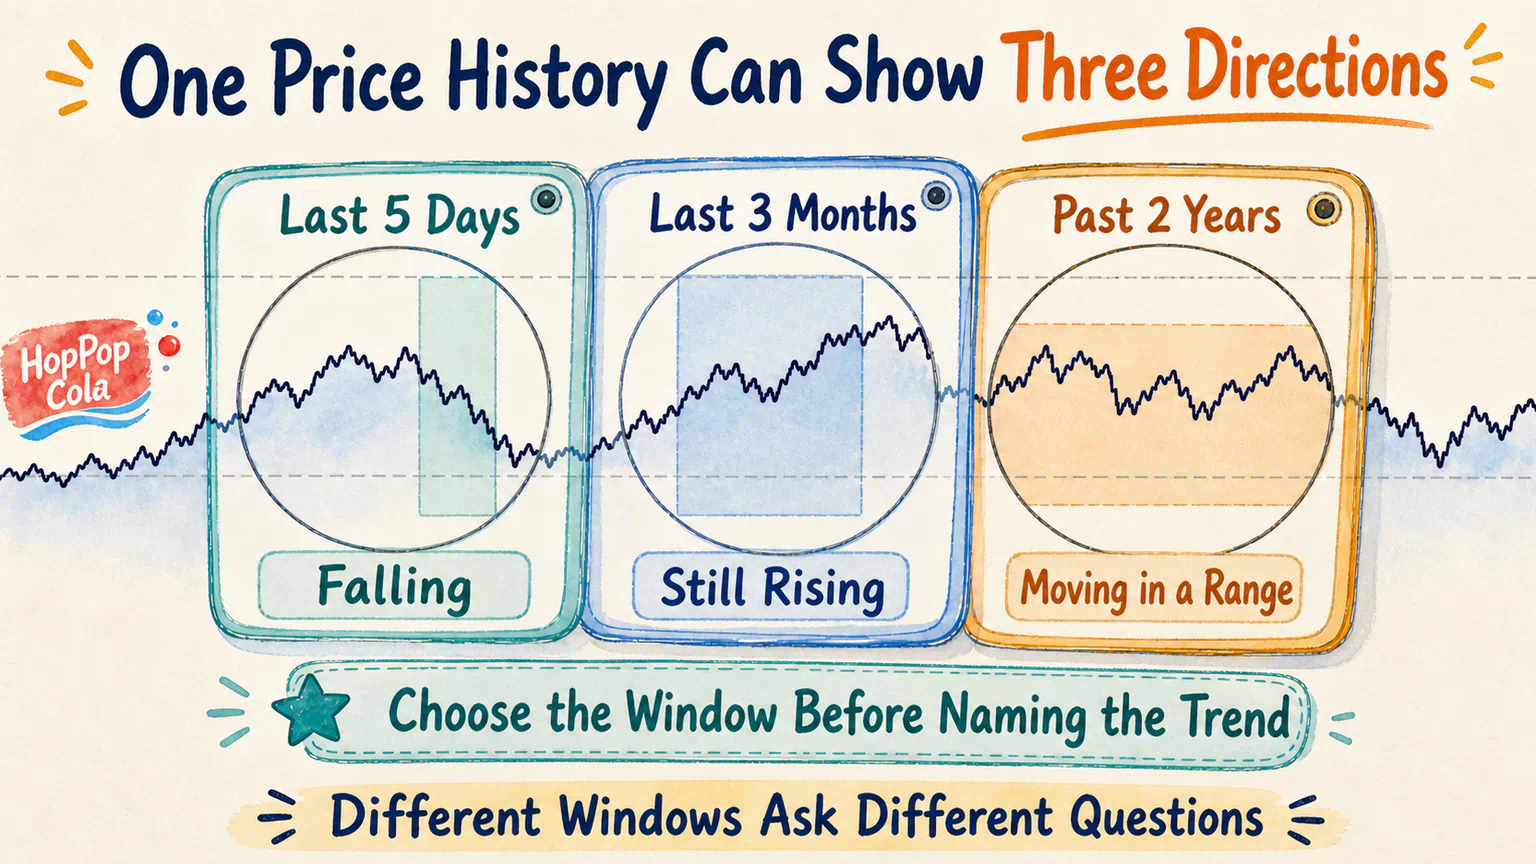
The chart is not lying. The statements answer three different questions.
“What is the trend?” sounds like a question about price. Hidden inside it is another question: How long are you looking?
Without a predefined observation window, a researcher can quietly change the lens whenever the result becomes inconvenient. A five-day decline becomes a three-month uptrend. If three months turn flat, the researcher announces that the long-term direction is still up. Every result can be explained, but the idea can never be shown to be wrong.
Trend research therefore needs to make several phrases precise:
Which period are we observing?
What counts as a direction appearing?
How long must it persist before we study it?
What event makes us admit that the trend has ended?
The time horizon does not have to mean frantic short-term trading. Some researchers observe days, others weeks or months, and some study much longer market moves.
Trend following describes the research question, not how often a trader must blink at the screen.
Moving Averages and MACD Are Rulers, Not Fortune-Tellers
A jagged sequence of daily prices can make direction hard to see.
People have therefore invented many ways to organize the record.
A moving average smooths prices over a period so that every small wiggle does not steal attention. MACD also works with smoothed price relationships to help describe direction and changes in momentum.
That is enough for now. Their calculations, parameters, and familiar signals belong in the later session on technical indicators.
The important point here is simpler: these tools begin with prices that have already happened.
They are rulers and filters. They help researchers describe “recent direction” consistently. A technical name does not give them advance knowledge of tomorrow.
The same price history can produce different readings under different moving-average lengths, parameters, or rules. That is not a minor detail to hide in a footnote. It is part of the research problem.
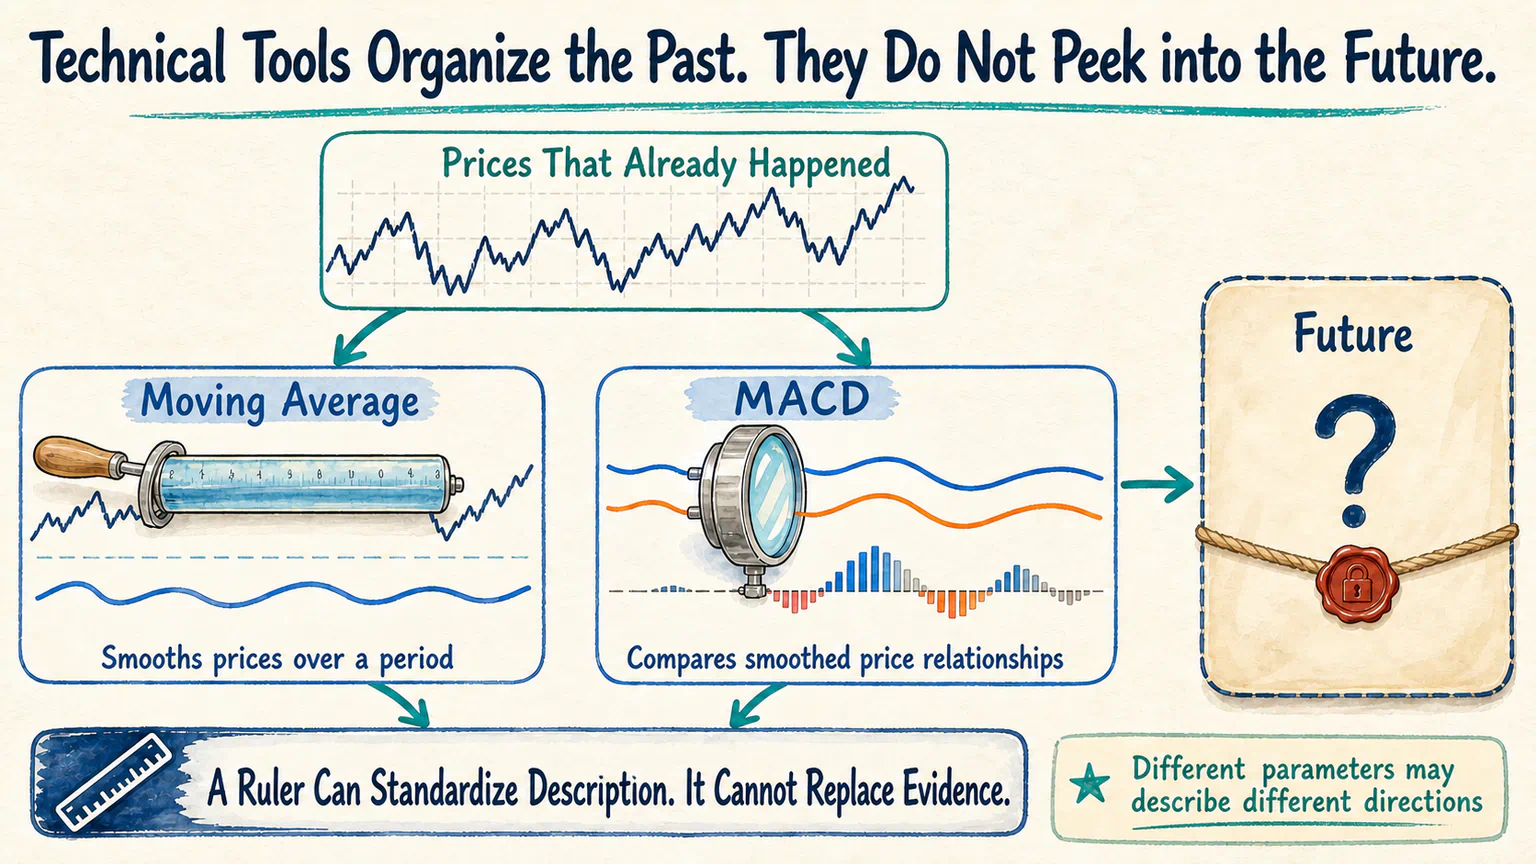
If a rule is selected only after the researcher has seen the result, it may simply be a rule that happens to fit that particular history.
The better questions are not “Does this indicator look accurate?” but:
How is direction defined?
When was the rule chosen?
Does it survive another period and another group of stocks?
What remains after trading costs?
This lesson will not answer those practical questions yet. We are placing them on the table so that we can return to them during quantitative testing.
Turning a Direction into a Rule
Richard Donchian is one of the representative figures in the history of systematic trend research.
He spent much of his career studying commodity and futures markets and turned trend ideas into rules that could be stated, followed, and checked. The CMT Association later recognized him as an early pioneer of trend following.
We will not study his specific rules here, and we will not carry a method from one market and era directly into A-shares.
His role in this lesson is to illustrate one important change:
“I feel that this chart will keep rising” mostly lives inside someone’s head. “Under these conditions, I define a trend this way” can be checked repeatedly with data.
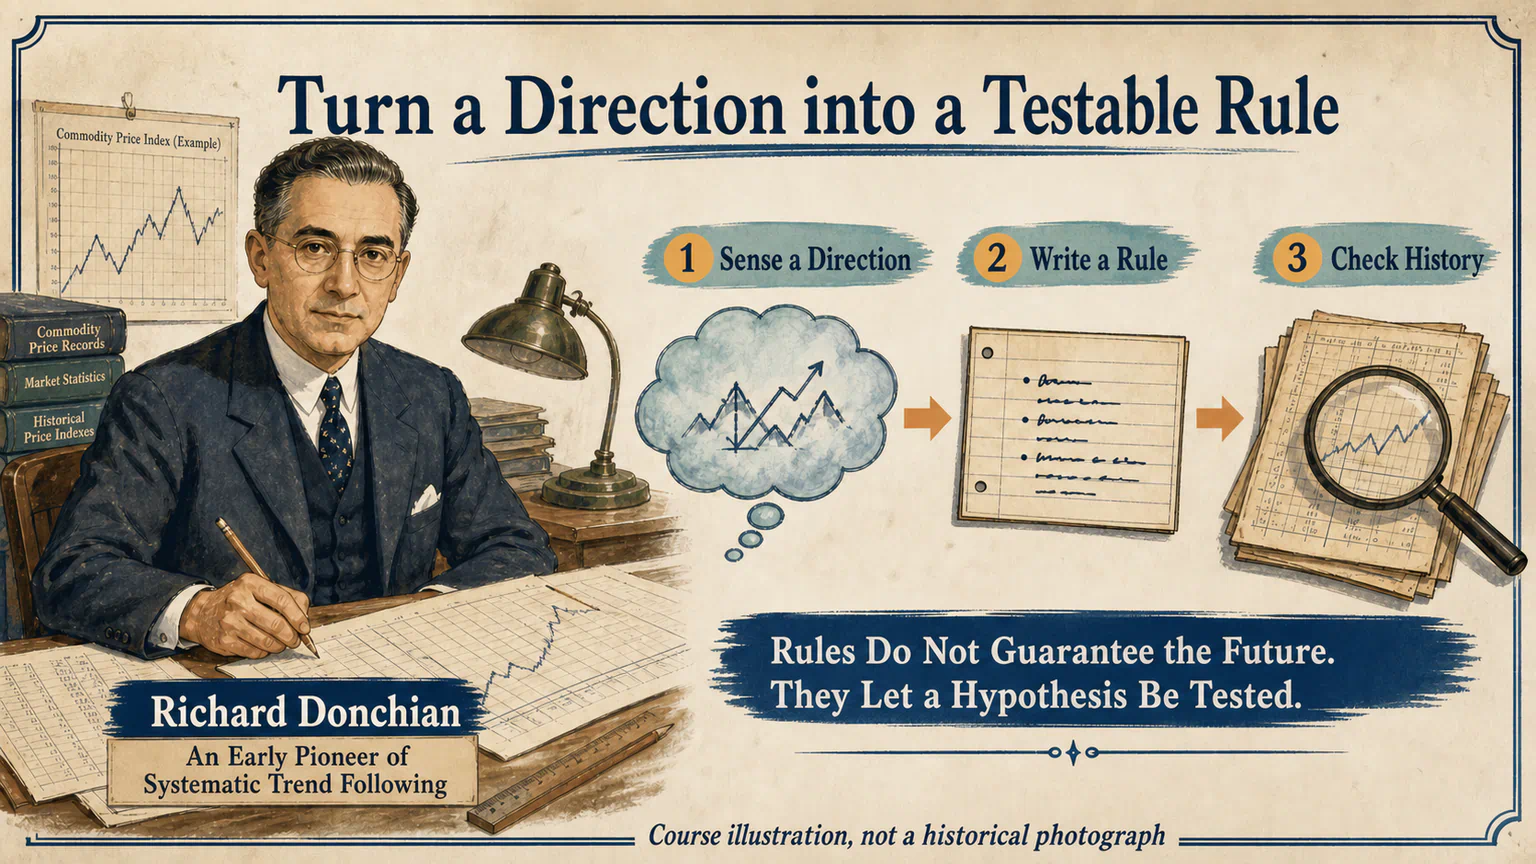
Modern research states related questions even more explicitly. Academic work on time-series momentum, for example, asks whether the direction of an asset’s own past return has a statistical relationship with its later return.
Some studies have found continuation across several futures and forward markets. Later research has challenged the strength of the evidence, the statistical methods, and the source of reported returns.
That disagreement is useful. A trend is not a law of nature carrying an official stamp. It is a hypothesis that must name its market, period, rules, and costs before it can be tested.
Put Trend Following on the Three-Dimensional Map
We can now place one typical form of trend research on our coordinate card.
What does it mainly observe?
The direction prices have already taken, how long the move has lasted, how it has fluctuated, and sometimes other market records such as volume.
Where might its advantage come from?
Information may enter prices too slowly. Investors may revise their views in stages. Large funds may need time to act. Attention and behavior may spread gradually through the market.
These are explanations waiting to be tested. A sequence of rising prices can reveal a candidate pattern; it cannot select the correct cause for us.
How long is it prepared to wait?
Days, weeks, months, or longer. The goal is not to force everyone into one horizon. It is to state the observation, evaluation, and holding windows before seeing the answer.
How does it find and check evidence?
Trend research often begins with price, volume, and time records, turns direction into an explicit rule, then asks whether similar conditions have repeatedly appeared in history. A mechanism helps produce the hypothesis. Statistical evidence checks whether the pattern is stable enough to deserve more research.
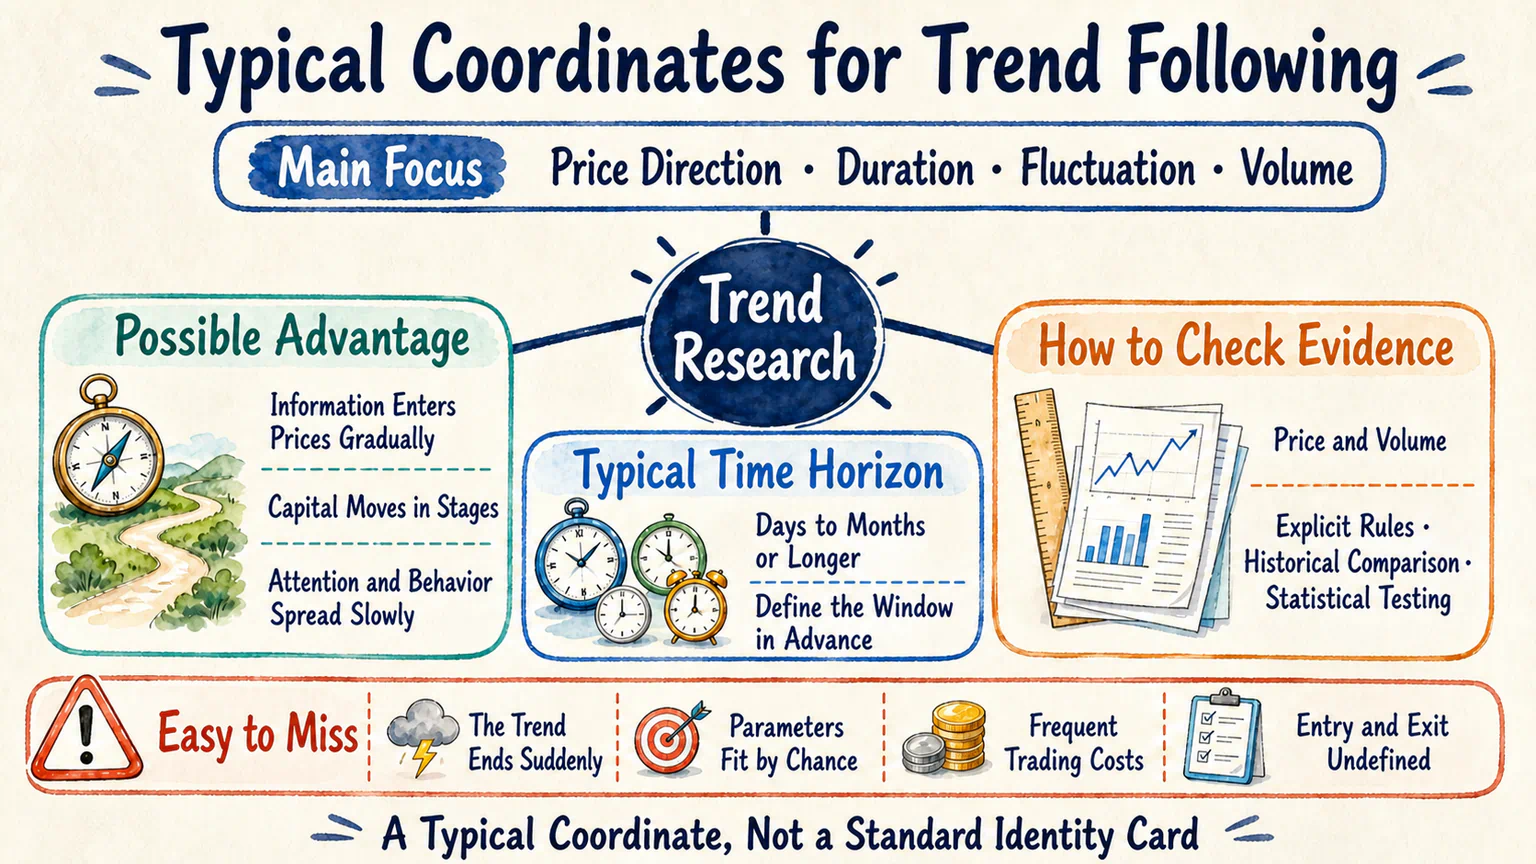
A typical coordinate might look like this:
Main focus: price direction, duration, fluctuations, volume, and other market records

Possible advantage: information and capital enter prices gradually,
so an existing direction may not end immediately
Typical time horizon: days to months or longer,
depending on windows defined in advance
Main methods: price and volume, explicit rules,
historical comparison, and statistical testing

Easy to miss: trends can break suddenly, parameters may fit by chance,
frequent trading creates costs, and entry and exit still need definitions
This is still a typical coordinate, not a standard identity card for every trend researcher.
Following a Trend Is Not Chasing a Mood
Hoppy looked again at HopPop Cola at 12 yuan.
He now knew at least two things.
“It rose from 10 to 12” does not mean “12 is a good price to pay.” But “it has already risen” does not mean “it cannot possibly rise again,” either.
Trend research tries to turn the unknown space between those statements into rules and evidence. It does not cover the gap with the slogan “follow the trend.”
A real trend strategy still needs to define when to enter, when to admit that a direction has ended, how much trading costs, whether a small parameter change destroys the result, and what happens after several wrong judgments in a row.
Later backtests will need assumptions for those questions. This lesson will not assemble them into a trading system.
Next Stop: Has the Price Gone Too Far?
Hoppy did not press the button simply because he saw a rising chart.
A few days later, he opened the same fictional stock and found that its price had suddenly fallen for several days in a row.
He watched the screen and produced an almost opposite question:
It has already fallen this much. Isn’t it about time for a rebound?
A trend researcher may first ask whether the earlier direction has ended. Another group begins with a different question: has the market gone too far?
References
Sources checked on August 12, 2026
- CFA Institute Research and Policy Center, “Which Trend Is Your Friend?”, used to check that time-series momentum and moving-average crossovers are common statistical ways to describe price trends and that filters depend on different historical horizons;
- Moskowitz, Ooi, and Pedersen, “Time Series Momentum”, used to check the classic framework that relates the direction of an asset’s own past return to later performance and its historical findings across multiple futures and forward markets;
- Huang, Li, Wang, and Zhou, “Time series momentum: Is it there?”, used to preserve later challenges to the statistical and out-of-sample evidence rather than presenting one historical result as a law;
- NBER, “Gradual Incorporation of Information into Stock Prices” and “Bad News Travels Slowly”, used to check gradual disclosure, diffusion, and incorporation of information as candidate explanations for continuation;
- CMT Association, “Richard Donchian” and its 2011 feature on Donchian, used to check his representative place in the history of systematic trend following and commodity research;
- CFA Institute technical-analysis learning material, used to check that moving averages and MACD are technical tools constructed from historical price data; this lesson does not use the source to teach signals or claim effectiveness.
HopPop Cola, the move from 10 yuan to 12 yuan, and the later decline are fictional teaching examples. This lesson introduces one typical location for trend following and provides no trading signals, parameters, backtest results, or investment advice.
Lesson discussion
Share a question, insight, or different view—and see how other learners are thinking.