Lesson 7
What Can News, Candlesticks, and Trading Volume Actually Tell Us?
Separate real-world changes, information channels, participant reactions, and market traces—and keep a plausible impact path distinct from proof of causality.
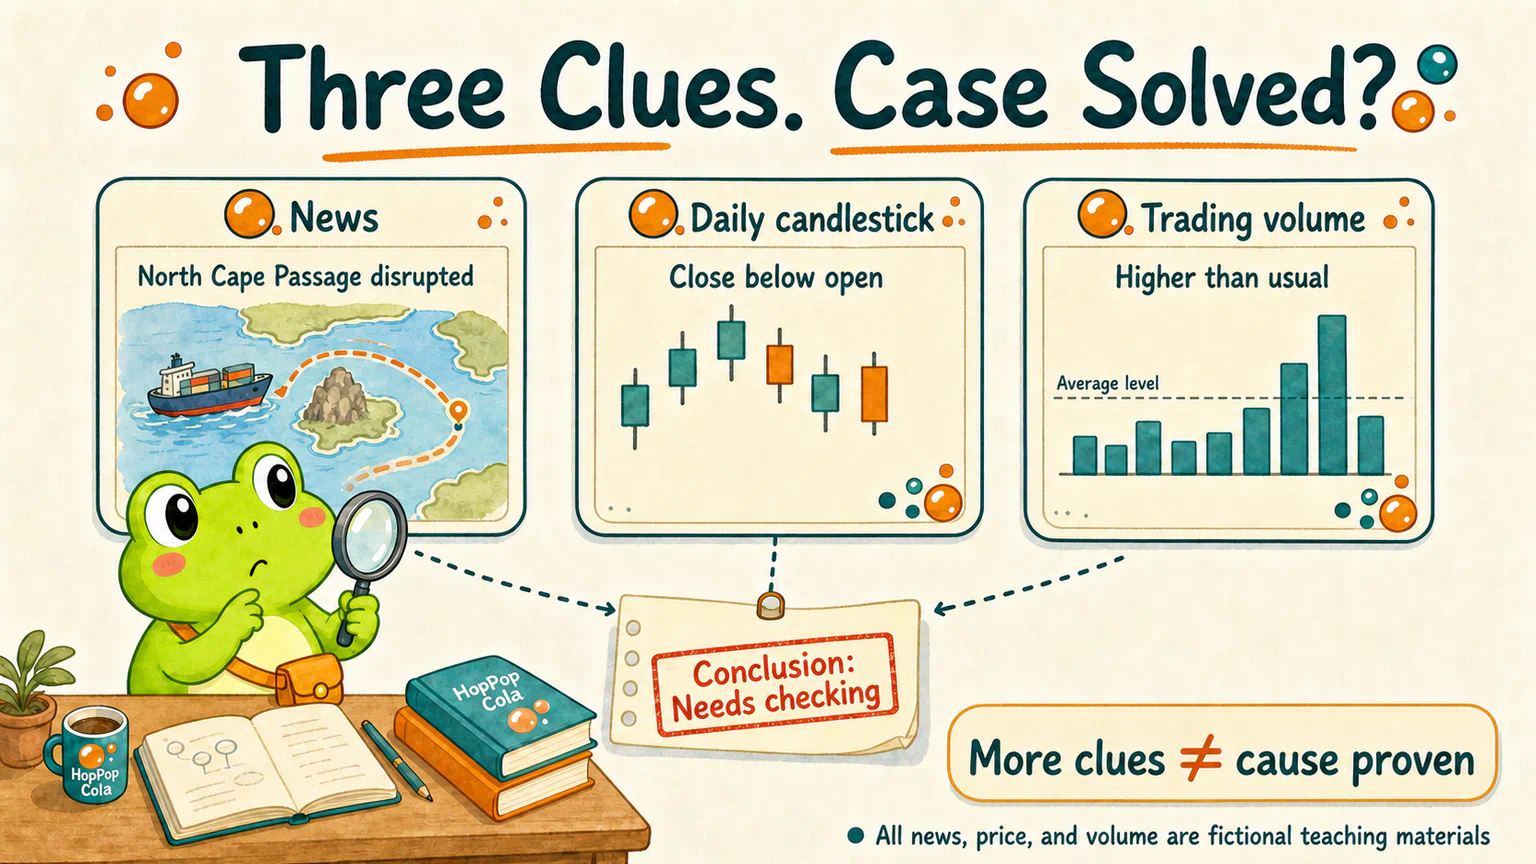
One afternoon, Hoppy had three things in front of him.
The first was a news story:
The North Cape Passage has been temporarily disrupted, and several cargo ships have begun taking longer routes.
The second was HopPop Cola's daily candlestick: the closing price was below the opening price.
The third was trading volume: noticeably higher than usual.
The “North Cape Passage” is entirely fictional. So are the news story, price move, and volume figures. None of them refers to a real event or stock.
Hoppy circled all three items.
The news fits. The price fell. Volume rose. With all three clues lining up, haven't we solved the case?
Dr. Hop crossed out “solved” and wrote two different words:
Needs checking.
At this point, we know that a story appeared, more shares changed hands, and HopPop Cola ended the day with a down candlestick.
But the story did not say whether any HopPop Cola cargo actually used that passage. The candlestick did not record why people sold. Volume did not come with a list of everyone's thoughts.
We do have more clues.
The proof of cause and effect has not arrived.
This course uses China's A-share market as its main source of examples. Other markets may use different candlestick colors, trading-volume units, disclosure channels, settlement rules, and data conventions. Those details must be checked in real research. The basic distinction in this lesson still travels well: an event, the window through which we learn about it, people's reactions, and the traces left by trades are not the same thing.
First, Give Each Item a Place
When market news arrives, it is easy to stir everything we see into one bowl.
Separating the pieces makes the problem much clearer.
Place One: What Changed in the Real World?
A company may lose a customer. A raw material may become more expensive. A shipping route may be disrupted. A policy or the wider economy may change.
These are real-world changes that could affect companies and markets.
In our fictional story, the real-world change is that traffic through the North Cape Passage was genuinely disrupted and some ships had to reroute.
Place Two: How Did We Learn About It?
News reports, company announcements, government documents, and economic-data releases can all bring a real-world change into public view.
They are information channels.
The channel matters. Without it, many people might not know that anything happened.
But a news report is not the shipping passage itself. A company announcement is not the company's entire operating floor. Each is more like a window through which we see part of reality.
Place Three: How Did People Interpret and Act?
One person may worry about shipping costs. Another may think inventories are sufficient. Someone else may believe the market has overreacted. A fourth person may simply need to rebalance a portfolio.
Each combines the new information with prior expectations, cash needs, limits, and deadlines, then decides to buy, sell, or do nothing for now.
These are participant reactions.
Place Four: What Did the Trades Leave Behind?
Once orders become completed trades, the market leaves records such as price, candlesticks, volume, volatility, and index performance.
These are market traces.
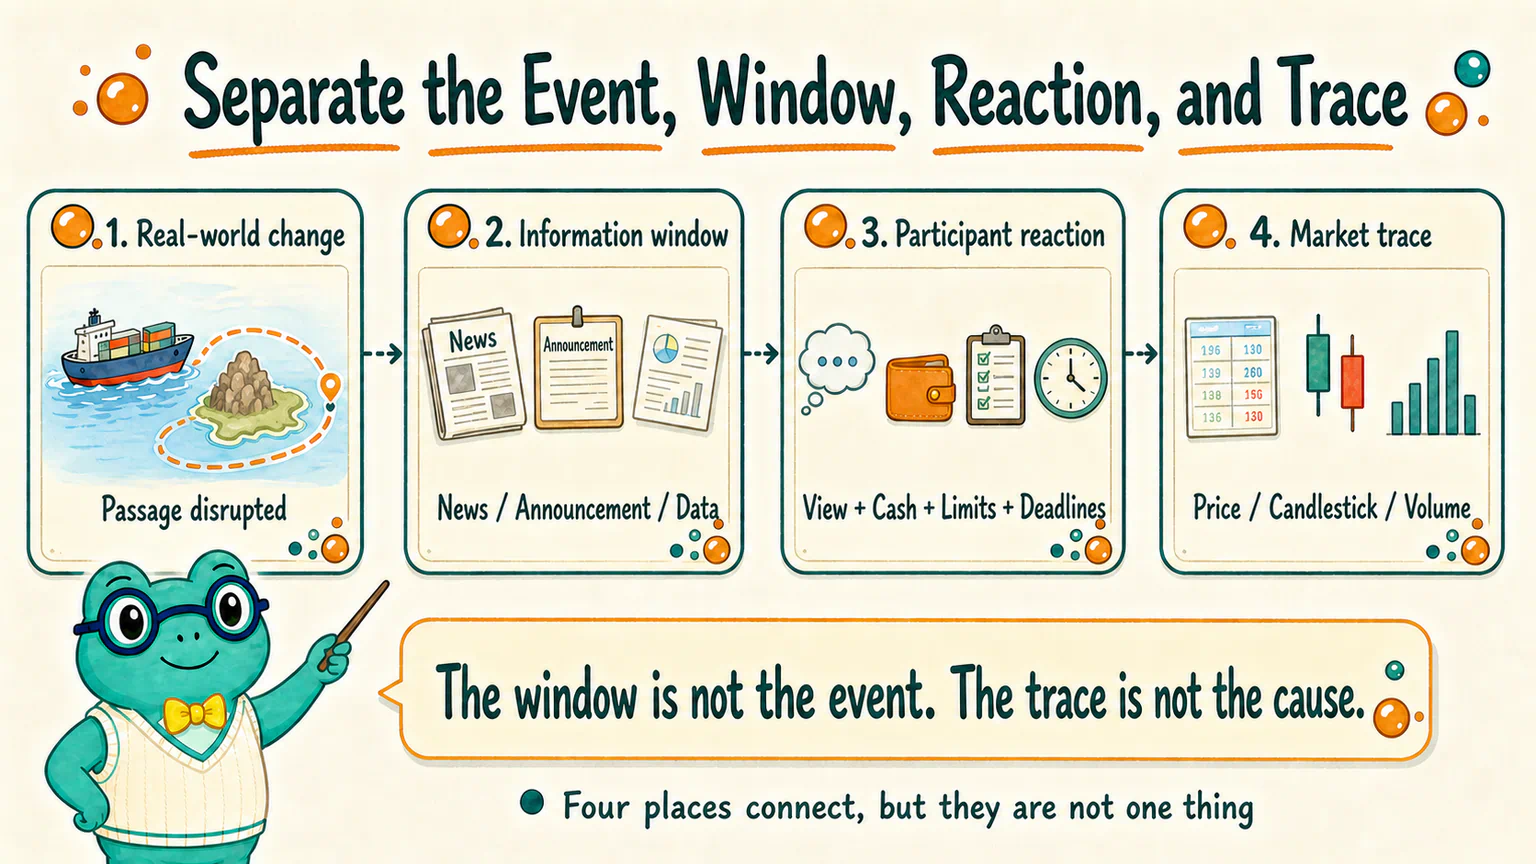
The event may be a cause. News and announcements are windows onto it. Buying and selling are participant reactions. Candlesticks and volume are traces left by trades. The four places connect, but they are not one thing.
News Tells Us That Someone Reported Something—not the Whole Reality
Return to the headline:
The North Cape Passage has been temporarily disrupted, and several cargo ships have begun taking longer routes.
It gives us useful clues: a location, a type of event, and the transport activity that may be involved.
But it does not tell us:
- whether the source was a shipping authority, a company interview, or an anonymous claim;
- how large the disruption was or how long it might last;
- which cargoes, companies, and routes were actually affected;
- how much extra time and cost rerouting would add;
- whether the market already knew or expected it.
If the headline adds, “Shipping disruption is bad news for beverage stocks,” it is no longer describing only the event. It has also completed part of the interpretation for us.
That interpretation may be reasonable, but it may skip several steps.
Does HopPop Cola depend on that route? Does it have inventory? Can it change suppliers? How important is shipping in the cost of one bottle? Do competitors face the same problem, or could some of them gain orders instead?
When a headline says something is “good” or “bad” for a stock, turn the label back into a question:
Whose conditions changed, what changed, and which path might carry the effect to the company?
An Announcement Is Usually Closer to the Company, but It Is Still a Window
Later that afternoon, HopPop Cola issued a fictional announcement:
Production is currently normal. Existing inventory can cover near-term needs, while some later shipping arrangements are still being assessed.
This gives us several pieces of information that are directly about the company.
At least within the time and scope covered by the announcement, the company says production is normal, near-term inventory remains available, and later effects are not yet settled.
Research does not end there.
How long is “near term”? Which materials are tightest? Who pays the rerouting cost? Are alternative routes already secured? What changes if the disruption lasts longer?
An official announcement matters because it is information the company has formally disclosed. It deserves priority over a group-chat screenshot or a secondhand retelling.
But an announcement answers only what it actually says. “Production is currently normal” cannot be expanded into “there will be no future effect.” “Still being assessed” cannot be translated into “trouble is certain.”
A clearer window does not mean we have inspected the entire building.
One Daily Candlestick Compresses a Day into Four Prices
Now look at the second item: the daily candlestick, also commonly called a K-line in Chinese markets.
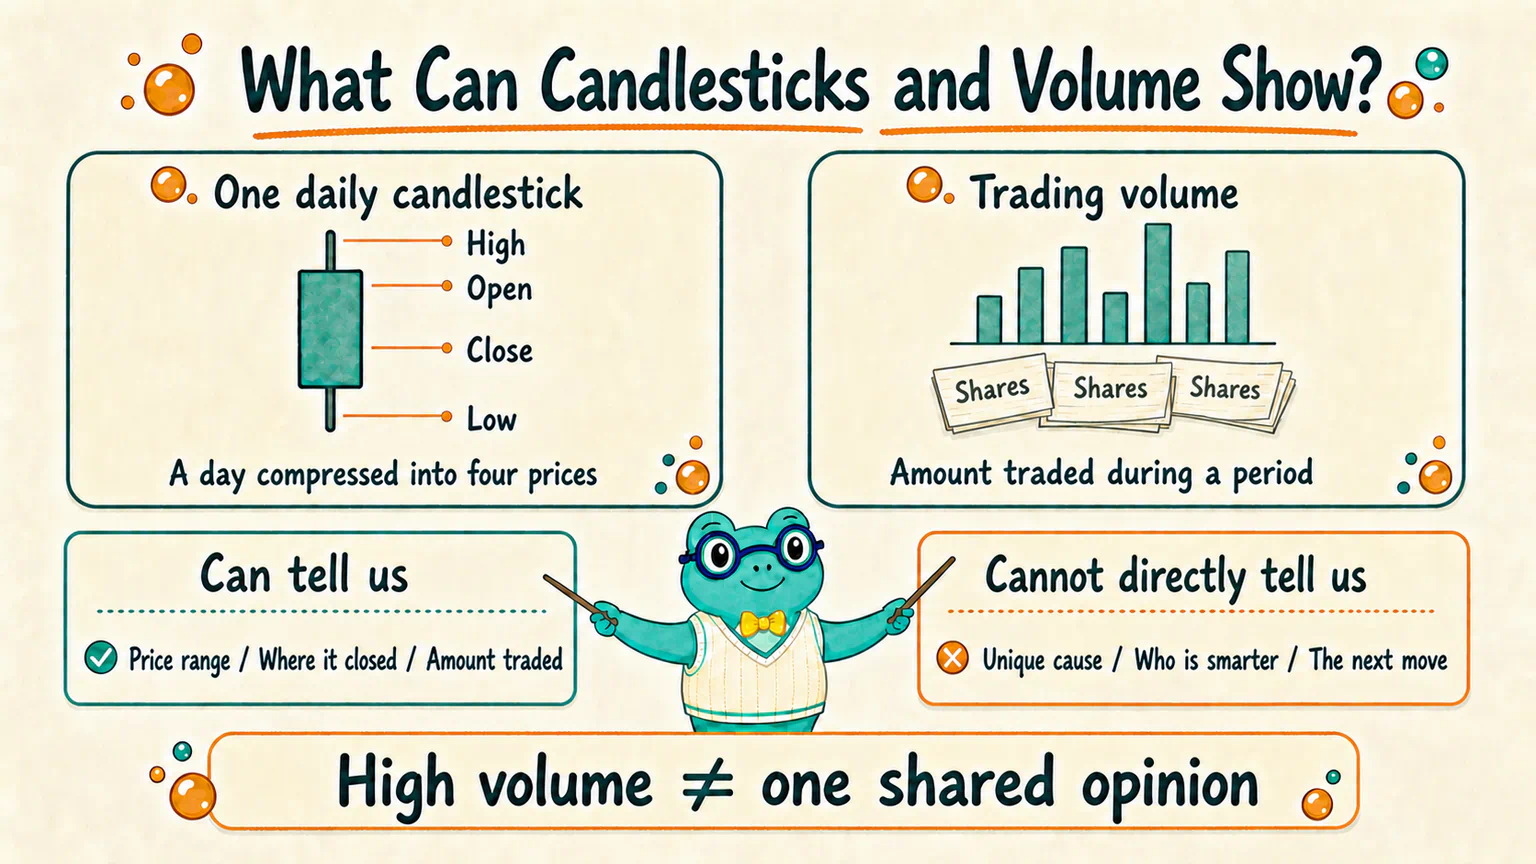
At its most basic, one daily candlestick records four prices:
open
high
low
close
It compresses many trades into one body and two wicks.
That is useful. At a glance, we can see where the day opened, the highest and lowest prices reached, and where it closed.
Compression also removes information.
Two days can have the same open, high, low, and close while following different intraday sequences. One might fall, recover, and fall again. Another might rise, fall, and bounce. If the four final numbers match, the daily candlesticks can look the same.
A down candlestick can therefore tell us: the closing price was below the opening price.
By itself, it cannot tell us:
- which story caused the move;
- who bought and sold;
- why each participant acted;
- whether the company's business actually became worse;
- what the next candlestick must look like.
Higher Volume Means More Trading, Not One Shared Opinion
Trading volume generally records how much of a security was traded during a period.
Whether an app displays shares, lots, or another unit depends on the market, product, and data source. Real research must check the definition first.
When volume is higher than usual, we can at least say that more securities changed hands and the market was busier.
But “busier” does not mean “everyone agreed.”
Remember the previous idea: every completed trade has a buyer and a seller.
The seller accepts the price, and so does the buyer. They may have completely different views, cash needs, and time horizons.
One million shares traded does not mean one million people traded. One account may divide an order into many pieces. Volume cannot automatically tell us who was smarter, who felt more certain, or which side will be right tomorrow.
It records how much was traded, not why everyone traded.
Technical Analysis Studies Traces; It Does Not Read Reality Directly
Candlesticks and volume do not become useless simply because they cannot prove a cause by themselves.
Quite the opposite: they preserve a record of how the market moved.
Technical analysis mainly studies price, volume, time, and the relationships among those market records.
Some researchers study trends. Some study volatility. Others study how price and volume move together. Later in our practical work, we may turn a price pattern into an explicit rule and test whether it actually repeated in historical data.
That is not the same as seeing a shape and instantly knowing what happened inside a company.
Technical analysis can produce hypotheses about market behavior. It cannot directly read factory inventory, customer demand, policy implementation, or whether a shipping route has reopened.
Company research cannot replace observation of trading results either.
They look at the problem from different places.
This lesson will not teach chart formations, indicators, or trading signals. For now, remember only the object being studied: records of market price, volume, and time.
Geopolitical News Must Travel Through the Real World Before It Can Reach a Share Price
“The North Cape Passage is disrupted” is a fictional geopolitical story.
Real regional disputes, sanctions, trade friction, and transport disruptions can affect markets. But “tension happened far away” is not yet a complete path to one company.
The effect might first travel through several routes.
Energy and Raw Materials
A disruption can change the supply or price of fuel, metals, food, or other inputs.
Companies that depend on imported materials may face higher costs. Producers of similar materials may receive more demand while also facing their own equipment, policy, or transport limits.
Supply Chains and Trade
Rerouted ships may take longer and incur higher freight and insurance costs.
If HopPop Cola uses the passage, the effect depends on inventory, contracts, alternative routes, and supplier locations. Nearshore Packaging may receive more inquiries if it produces locally, but whether it has enough capacity is a separate question.
Policy Responses
Governments may adjust trade rules, reserves, subsidies, regulation, or interest rates. Those policies then affect companies through rules, costs, and demand.
Risk Appetite
Even when a company's cargo never uses the passage, market participants may reduce risk as uncertainty rises, changing positions while they wait for more information.
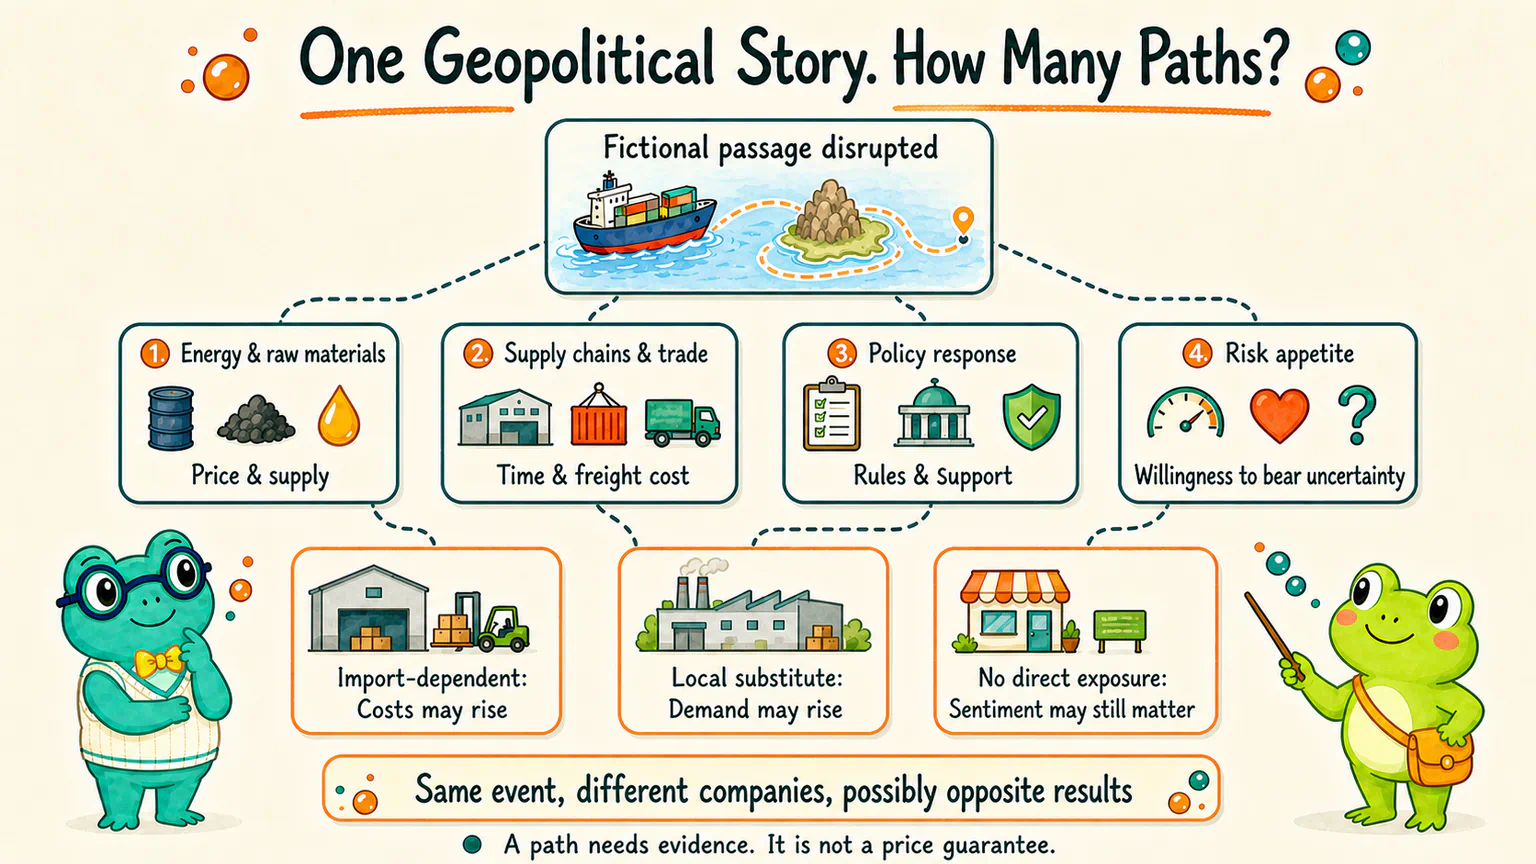
The same geopolitical story may therefore raise cost concerns for one company, create substitution demand for another, and have little direct operating effect on a third.
Counting how often words such as “conflict” or “tension” appear in the news cannot automatically produce a company's profit or a stock-price direction.
This course can help us map the possible paths from a geopolitical event. Its first practical stage will not teach the quantification of news text, geopolitical narratives, or subjective stories.
The reason is practical: event definitions, sources, timing, affected objects, and language are much more complicated than daily price data. Giving a story a sentiment score before those questions are settled merely puts a numerical coat on a subjective judgment.
Reconnect the Whole Path
We can now place everything we have learned on one map.
something changes in the real world
→ company, industry, economic, or policy conditions may change
→ news, announcements, or data allow more people to see it
→ participants combine it with expectations, cash, limits, and deadlines
→ some judgments become completed trades
→ price, candlesticks, volume, volatility, and indexes leave traces
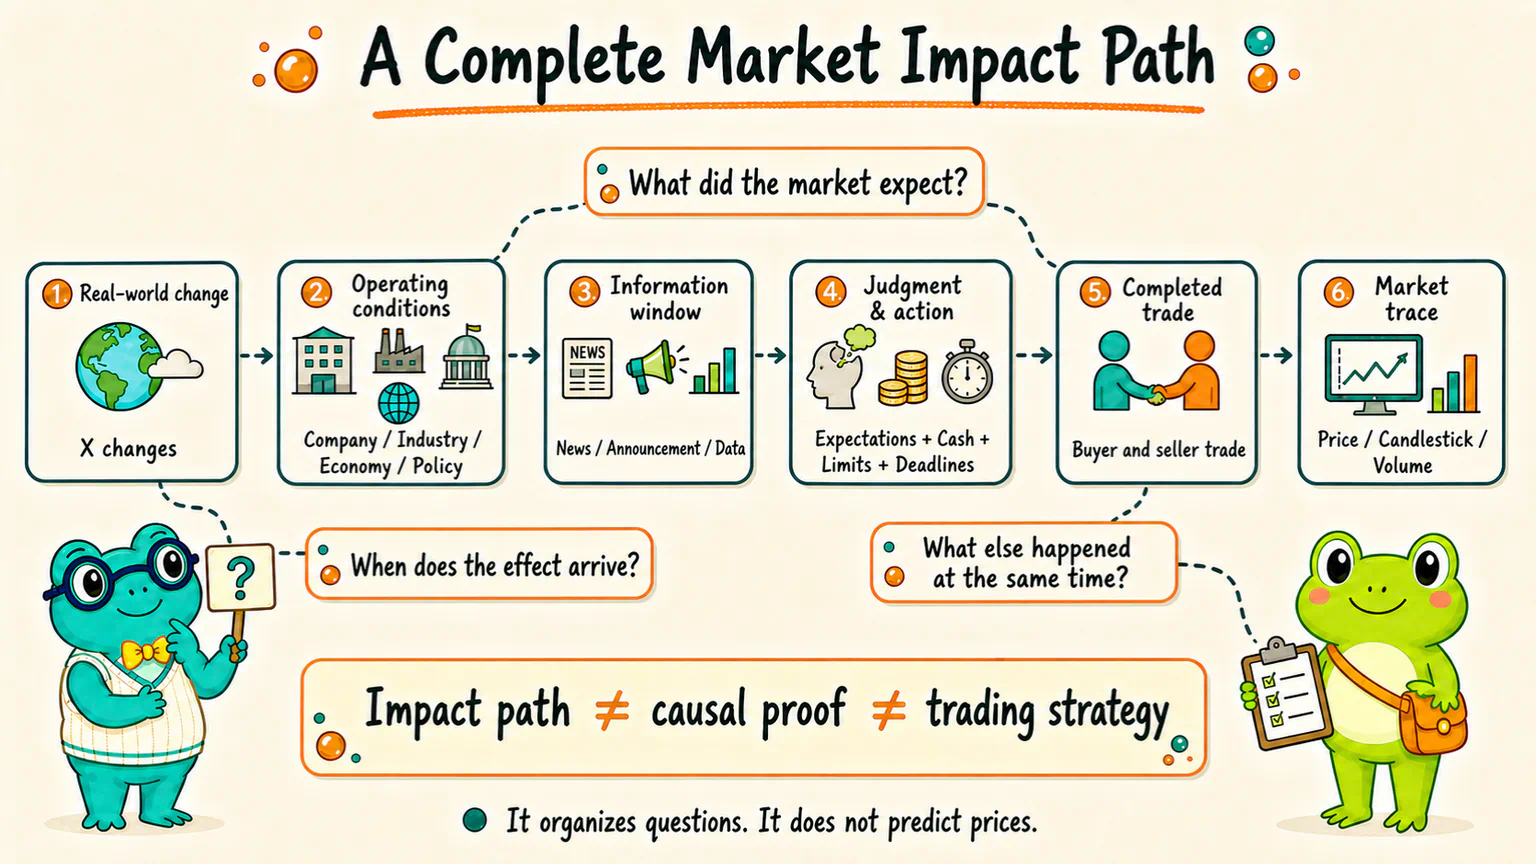
This is not a perfectly ordered, one-way assembly line.
A company may feel the effect before a news story appears. The market may hear rumors before a formal announcement. Several factors can change at once, and participants can observe price movements and adjust their emotions in return.
Keep three questions beside the map:
- What did the market expect before? How different is the new information?
- When might the effect arrive? Does it change orders today or possibly years from now?
- What else happened at the same time? Were the company, industry, economy, policy, and participant behavior all changing together?
Because X changed, it may first change Y, then affect people's judgment or action toward Z, and only then leave a trace in price through trading. But prior expectations, the timing of the effect, and other things happening at the same time can all change the result.
This is not a forecasting formula.
It helps us turn a vague “good” or “bad” label back into a question we can investigate.
Return to Hoppy's Three Clues
Now revisit the opening scene:
- the news tells us that a media outlet reported disruption in the North Cape Passage;
- the fictional announcement tells us that HopPop Cola says near-term production is normal while later shipping remains under assessment;
- the daily candlestick tells us that the closing price was below the opening price;
- volume tells us that more shares traded than usual.
Together, they make “the passage event changed participant actions” an explanation worth investigating.
But we still need to check shipping exposure, cost changes, inventory, news timing, market expectations, and other simultaneous events before the explanation becomes better supported.
Even if those pieces line up, proving cause and effect requires stricter comparison and quantitative testing.
Hoppy finally erased the words “case solved.”
He wrote this instead:
We have a plausible path, not a proven pattern.
It is less dramatic, but much closer to research.
If You Want to Practise with AI
This is optional and requires no local setup.
If you already use Codex or WorkBuddy, you can give it this self-contained prompt:
Optional AI practice
I want to practise separating real-world events, information channels, participant reactions, and market traces. Give me one entirely fictional stock-market scenario containing: one real-world change that might affect a company or industry, one news headline or announcement summary, and simple price and trading-volume observations. Do not use real companies, countries, wars, or stocks. Do not predict prices or give investment advice. First ask me to classify each item, then use follow-up questions to help me build one possible impact path. Do not reveal a model answer immediately. Remind me that a plausible path is not proof of causality.
The purpose is not to make AI solve the exercise for you.
It is asking AI to act as a practice partner that keeps asking useful questions.
Next, Stop Adding More Causes
We have now seen company operations, industry conditions, the wider economy, policy rules, and participants' own money and emotions.
We also know that a real-world change must pass through information, judgment, and trading before it may leave a trace in price.
The next step is not to add an eighth item to the list of market influences.
We will change the question. Faced with the same market, why do some investors study companies and economies, some search for statistical patterns, and some focus on price records? Where do they believe their advantage comes from, how long are they willing to wait, and what evidence would convince them that they may be right?
References
Sources checked on August 11, 2026
- Shenzhen Stock Exchange Investor Education: Stock Market Beginner's 300 Questions, Part 13, used to check that a daily candlestick contains the open, high, low, and close and that technical analysis studies market records including price, volume, and time;
- U.S. Securities and Exchange Commission: Saving and Investing for Students, used to check that historical market data commonly includes opening, closing, high, and low prices together with trading volume;
- Investor.gov: Consolidated Tape, used to check that post-trade market data reports transaction prices and volume;
- Shanghai Stock Exchange Stock Listing Rules, April 2026 Revision, used to check basic A-share requirements and channels for public disclosure of material company information;
- FINRA: What Is Momentum Investing?, used to check that technical indicators commonly draw on market records such as price, volume, or open interest and that continuation of past momentum is not guaranteed;
- IMF: How Rising Geopolitical Risks Weigh on Asset Prices, used to check how geopolitical risks can affect markets through trade, capital flows, supply chains, commodity prices, and risk appetite, with uneven effects.
The North Cape Passage, regional dispute, shipping disruption, HopPop Cola announcement, Nearshore Packaging, prices, volume, and participant reactions are fictional teaching examples. This lesson does not analyze real geopolitical events, teach candlestick patterns, technical indicators, news quantification, or trading strategies, and it does not provide investment advice.
Lesson discussion
Share a question, insight, or different view—and see how other learners are thinking.