Lesson 1
We Bought It. When Do We Sell?
Compare a small set of exits on the same entry events, then select and freeze an exit rule using a prior standard.
Hoppy opens the research handoff from the previous lesson.
What to buy and when to enter are already settled. The exit field still says, “Day ten, for now.”
“That still feels a bit arbitrary,” he says. “What if things start looking wrong on day six? Do we just sit there until day ten?”
Dr. Hop scrolls down the document.
“How would you decide that something looks wrong?”
“Maybe MACD starts falling, or trading volume drops. Surely that's better than just watching the calendar?”
It sounds reasonable.
But we already know what comes after “sounds reasonable”: test it.
This time, the entries stay exactly as they are. We'll change only the exit rule and see whether the results improve.
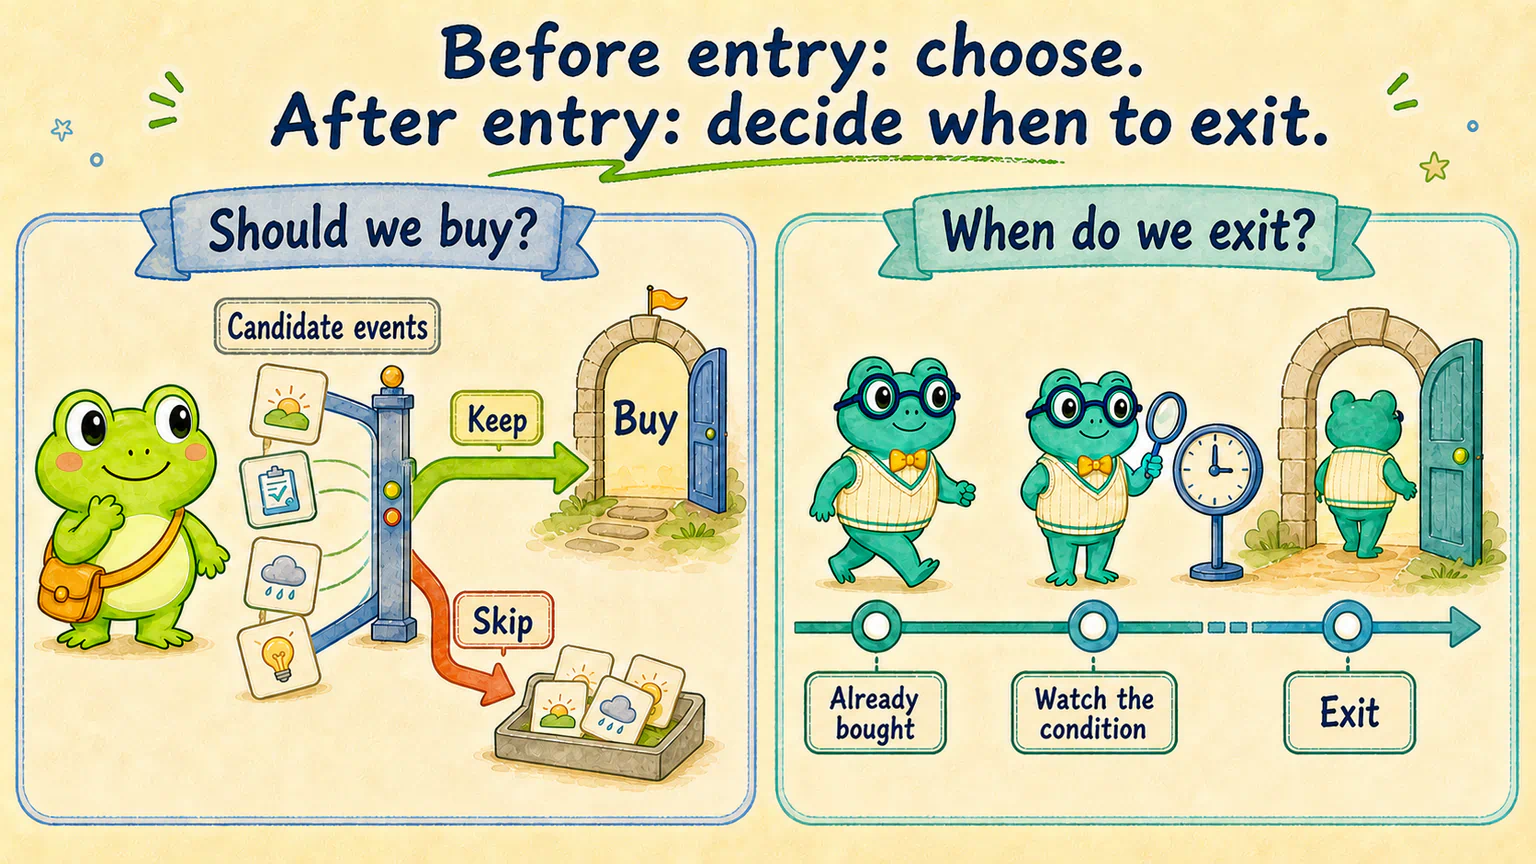
Last time: should we buy? This time: when do we leave?
The previous lesson's filter worked like a checklist for possible entries.
Events that met the condition stayed; the others were skipped. For every retained event, we still entered at the next valid bar's open after count 9 was confirmed at the close.
This time, we've already decided to participate in those events. We aren't filtering them out again.
Imagine that both versions of a trade begin at Monday's open. One exits on a scheduled date. The other checks an indicator each day and prepares to exit when its condition appears.
An entry filter asks, “Do we take this opportunity?” An exit rule asks, “Once we're in, when do we leave?”
So the subject of this lesson is exit rules—or, more simply, different ways to decide when to sell.
What could we watch instead of the calendar?
Let's start with two familiar indicators, without adding more moving parts yet.
First, the MACD histogram.
Earlier, we used it to check for improvement when a Nine-Beat Count completed. Now the question changes: if the histogram falls after we enter, might that be a useful time to end the trade?
To make the idea testable, we'll give “falls” a simple meaning: today's histogram value is strictly lower than the previous valid bar's value.
We're comparing numbers, not how long the bars look on a chart. A move from -0.1 to -0.2 is a decrease too.
Second, relative volume.
Suppose a stock averaged 1 million shares per bar over its previous twenty valid bars, but only 700,000 shares trade today. Today's relative volume is 0.7: 70% of that recent average.
Our hypothesis is that, after entering, preparing to exit when volume drops below 80% of its recent average might work better.
Lower volume does not mean the price must fall next. A falling MACD histogram isn't an instruction to sell, either. These are two ideas we're going to check against data.
An exit rule needs the whole sentence
“Sell when MACD falls” sounds clear. But it leaves two questions unanswered.
When do we start checking? And what if the condition never appears?
Here's the complete version for this lesson:
| Exit rule | When to sell | What if no condition appears? |
|---|---|---|
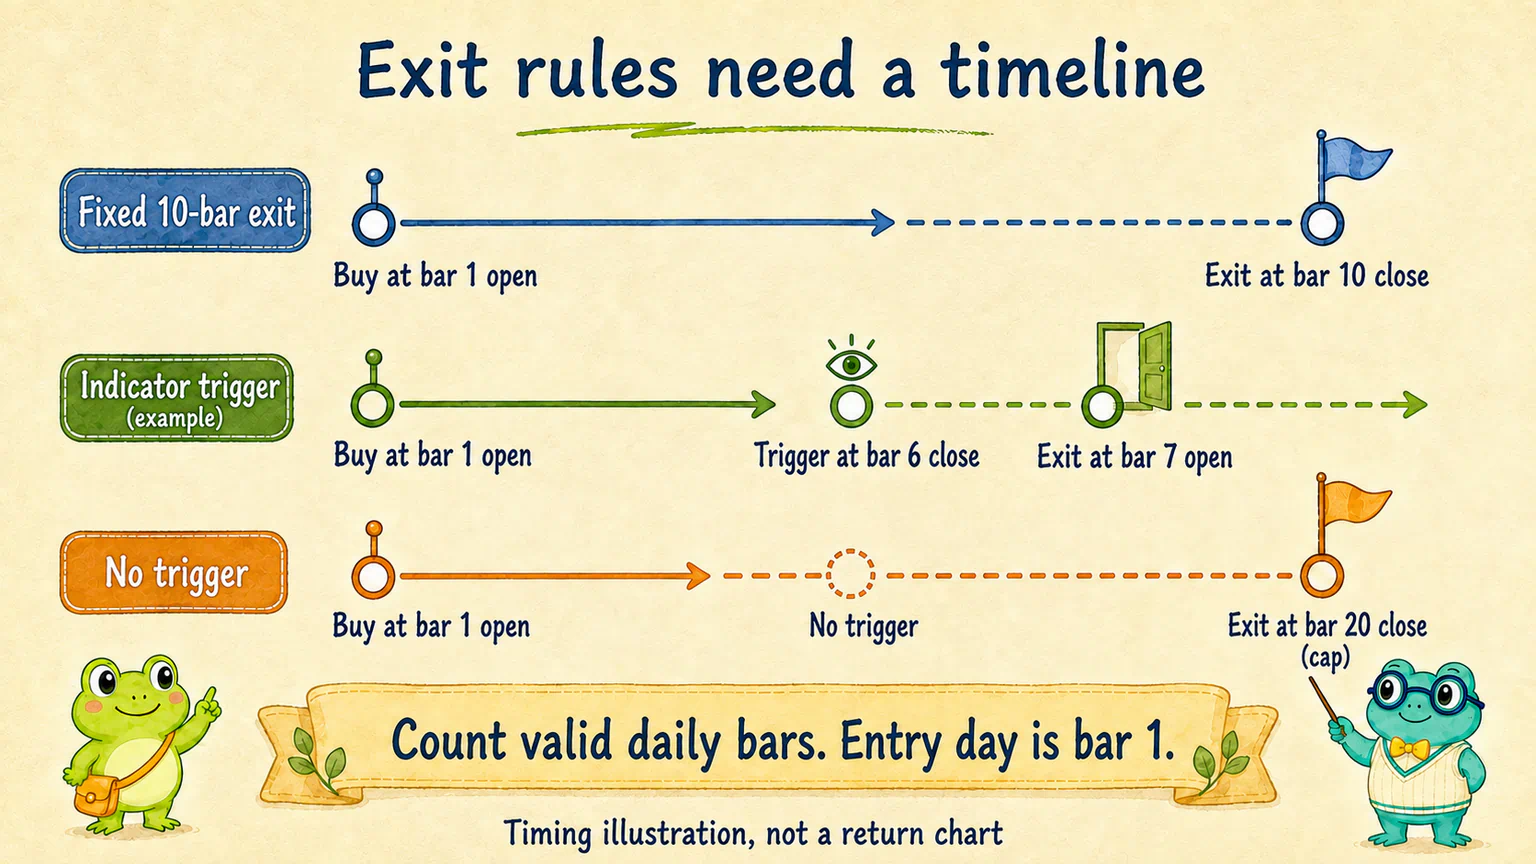
| Fixed 10-bar exit | Count the entry bar as bar 1; exit at bar 10's close | Exit on schedule, without waiting for an indicator |
| MACD exit | Check from the entry bar's close; after the first lower histogram value, exit at the next bar's open | Exit no later than bar 20's close |
| Volume exit | Check from the entry bar's close; after relative volume first falls below 0.8, exit at the next bar's open | Exit no later than bar 20's close |
“Ten days” and “twenty days” here mean valid daily bars for that stock—not ten or twenty calendar days.
Why wait until the next open after an indicator triggers?
Because we're using the completed day's closing price or trading volume. By the time those figures are available, the day has closed. We can't pretend we knew them earlier and sold at that same closing price.
For example, if the MACD histogram first falls at the close of holding bar 6, we exit at bar 7's open. It could also fall on the entry day itself. In that case, we exit at the following bar's open; we don't have to wait ten bars.
If the first trigger comes at bar 19's close, we exit at bar 20's open. Only if no trigger appears do we use bar 20's close as the fallback.
Twenty bars is a maximum waiting time here, not a separate fixed 20-bar exit competing for selection. The cap prevents a trade from remaining open indefinitely while the AI waits for a condition that never arrives.
Talk through your idea with AI first
Open your existing research project and ask Codex to read the saved entry-rule handoff. WorkBuddy is an alternative if you can't use Codex.
If you're starting a new conversation, tell it where that handoff is. The AI doesn't need to remember our earlier chat, but it does need the actual records saved in your project.
You could start with this:
Ask your AI research assistant
Read the entry rules, data locations, and experiment records saved in this project. Briefly explain which events we currently enter, when we enter them, and how the previous 10-bar returns were calculated. If you cannot find the handoff, ask me for it rather than guessing my choice.
I want to keep the entries unchanged and use an exit at the close of the tenth valid daily bar as the baseline. Separately test an exit after the MACD histogram falls and an exit after relative volume drops below 0.8. Do not combine the two indicator rules. Don't calculate yet. Use plain language and a simple example to help me specify when observation starts, what triggers an exit, when the sale actually happens, and what to do if no trigger appears.
For now, do not change the entry rules, add capital or costs, or read or calculate any 2023 prices, indicators, signals, or returns.
Then keep asking questions.
For instance: “I thought MACD had to drop below zero to count as falling. Are we talking about the same thing?”
Or: “The price could keep rising after volume falls. Why test this exit at all?”
These conversations aren't a detour. They turn “I think this might be a better way to sell” into a rule you and the AI both understand.
You can use a different definition if you want. Record it as your own version before running it. Don't quietly change a threshold after seeing the result and still call it the same experiment.
To follow the course version, use the complete reference task at the end of this page. It contains all three rules, ready to give to your AI. You don't need to assemble the formulas yourself.
Before running, agree on a fair comparison
We don't need a funded account yet. We'll take each entry event separately and try all three exits on it.
But the three rules must use the same events.
Both indicator rules might wait as long as twenty bars. If the research period ends before an event has twenty bars available, leave that event out of the main comparison. The 10-bar rule must use that same list, rather than including a few extra events of its own.
This is a sample convention for comparing historical outcomes fairly. It is not an entry filter that can predict whether future price records will be available.
We'll also agree on a simple selection rule in advance: consider a new exit only if its median return beats the 10-bar baseline by at least 0.20 percentage points, while neither its mean return nor its share of positive returns falls. Look at holding time alongside those figures too.
That isn't a universal market standard. It's the selection method for this experiment. If neither alternative passes, keep ten bars. We don't need a new rule just for the sake of having one.
Once the rules are clear, let the AI actually run them and produce a summary and comparison chart. It can handle program structure and missing dependencies. Your job is to check whether it's doing what you agreed.
Our results: the 10-bar exit stays
The course reference route still uses completed falling Nine-Beat events in the PY-10 “Mobility Networks” industry, entering at the next bar's open after confirmation. The research period remains 2021–2022.
We continue with the fictional teaching dataset used in the A-share examples. Company and industry names are invented; they are not real investment targets. The English lesson uses the same dataset and dates, not a separate US-market experiment.
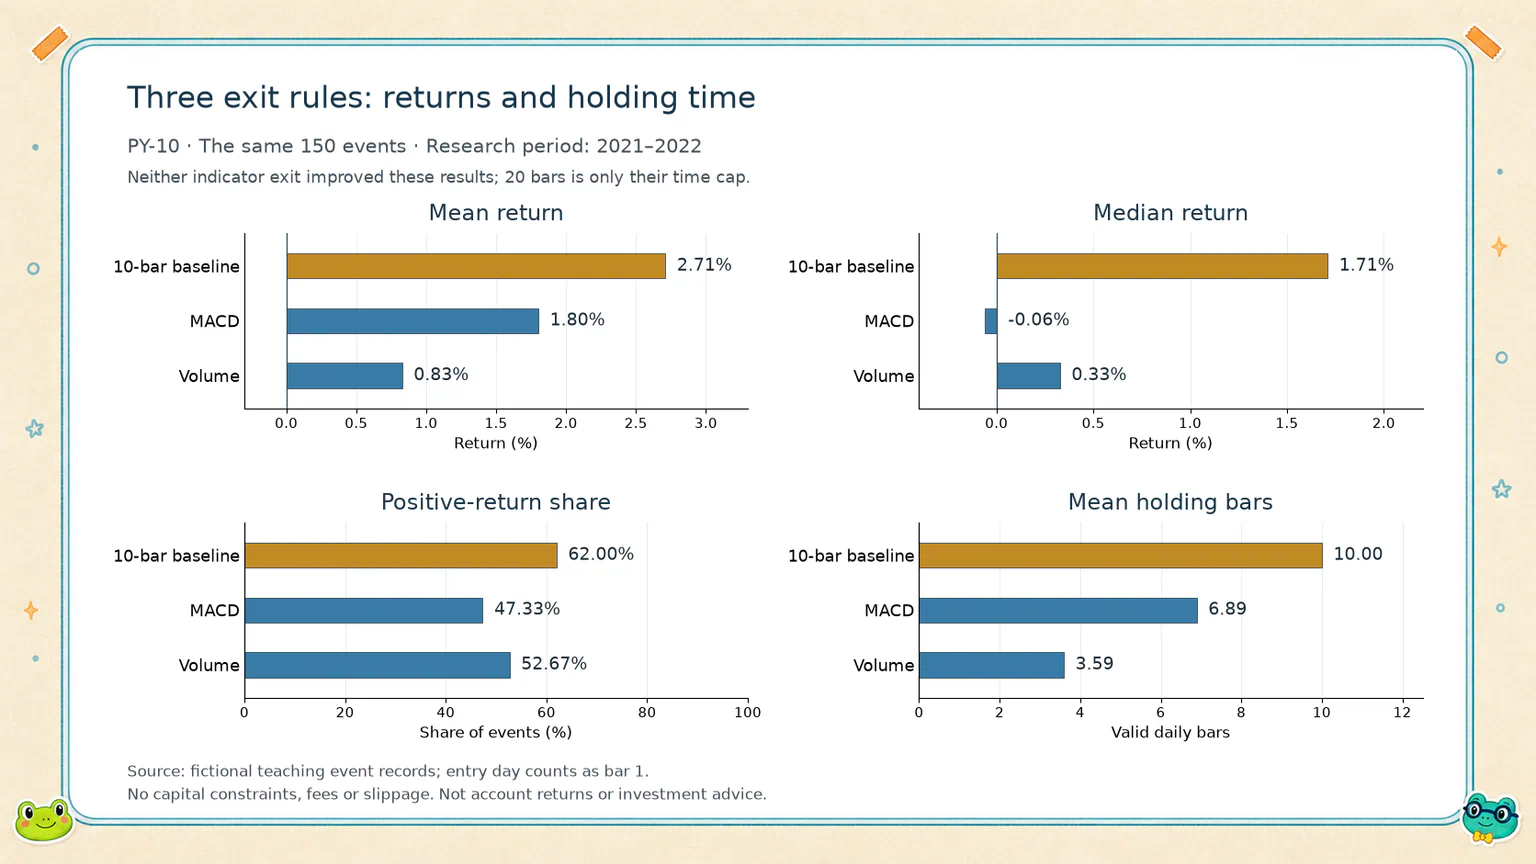
The previous lesson had 151 events with complete 10-bar windows. One of them does not have twenty bars available within the research period. All three exits therefore use the remaining 150 events, covering 22 companies.
That means recalculating the 10-bar result too. Its mean still rounds to 2.71%, but its median changes from the previous lesson's 1.93% to 1.71%, and its positive-return share changes as well. The method hasn't changed; the sample has one fewer event.
| Exit rule | Mean return | Median return | Positive-return share | Mean holding bars |
|---|---|---|---|---|
| Fixed 10-bar exit | 2.71% | 1.71% | 62.00% | 10.00 |
| Exit after MACD histogram falls | 1.80% | -0.06% | 47.33% | 6.89 |
| Exit after relative volume falls below 80% | 0.83% | 0.33% | 52.67% | 3.59 |
These figures describe individual events in fictional teaching data. They are not account returns or investment advice.
Hoppy studies the table, looking slightly disappointed.
“I thought adding an indicator would be smarter than just selling when the time was up.”
This time, the data didn't support his expectation.
The MACD rule held for about seven bars on average, less than ten. But its mean return, median return, and positive-return share all fell. The slightly negative median also reminds us not to focus only on the 1.80% mean.
The volume rule exited even sooner: about three and a half bars on average, with a median holding time of just two bars. At least half the events exited at the open immediately following the entry bar.
That doesn't necessarily mean the program was in a hurry. We told it to exit when relative volume fell below 80%, and that condition appeared quickly in these events.
Neither alternative passed the agreed improvement criteria. So, among these three rules, the course keeps the fixed 10-bar exit.
Don't just ask which rule won. Ask how it sold.
A summary table shows the overall picture. An actual event record shows exactly when a rule took effect.
Take one event for the fictional company Skybrook Mobility:
- The falling Nine-Beat Count completed at the close on January 29, 2021.
- The entry was at the open on February 1.
- By that day's close, relative volume was already below
0.8. - The volume rule therefore exited at the February 2 open, for an event return of about
-0.39%.
It didn't wait until bar ten. Its exit condition wasn't “the stock price falls,” either. It followed the volume condition we'd specified.
Sometimes the condition never arrived. Of the 150 volume-rule events, two used the bar-20 closing fallback. Every MACD-rule event triggered an exit within the cap.
You don't need to pick the same example as the course, or calculate every trade by hand. Ask your AI:
Check the work with AI
From the actual results you just produced, find one early indicator exit and one exit at the maximum holding limit. If a type does not occur, say so. For each example, explain the entry date, when and why the condition triggered, which information was available then, and the final exit date and price type: open or close. Cite the actual trade records; do not invent illustrative results.
Also check that all three exit rules used the same events and that indicator-triggered exits really waited until the next bar's open. Separate implementation problems from disappointing rule performance.
If the AI uses an indicator known only after the close but sells at that same close, the implementation doesn't match the agreement. Fix it.
If the timing is correct and the new rule simply earns less, that's an experiment result—not a software bug to “fix.”
Keeping the old rule isn't wasted work
This time, we didn't find a better exit than ten bars.
But we didn't learn nothing. We started by guessing that watching another indicator would help. Now we can say: for these events and these two definitions, we did not see an improvement.
Don't stretch that conclusion. It doesn't mean “MACD is useless” or “volume is useless.” We tried one use of each, not every possible definition.
You can open a separate research record and explore another idea. But you don't need to keep changing things until a pretty result appears just to produce a more sophisticated-looking rule.
Adding a rule doesn't automatically add a return. Testing an idea and keeping the original approach can be an evidence-based decision too.
If you're following the course, ask your AI to add the decision to the handoff:
Save the exit-rule handoff
Keep the current entry rules unchanged. Save the actual results of these three exit rules and the reasons for the choice in a separate research handoff, preserving all earlier experiments. The course reference exit remains: count the actual entry bar as bar 1 and exit at the adjusted close of the tenth valid daily bar. Do not automatically use a candidate from another exploratory version as this decision. Do not turn the historical requirement for twenty complete bars into an account-entry filter. Note that finite capital, trading costs, and the 2023 holdout have not yet been tested.
If you're following your own route, replace that exit with the version you actually chose. Later results can differ from the course. What matters is that the handoff matches the experiment you ran.
Hoppy puts “fixed ten bars” back in the exit field.
This time, it isn't just a date he added without much thought. It's the rule he's keeping after comparing it with two specific alternatives.
“Can we finally see what happens in an actual account?”
Almost. So far, we've calculated each opportunity separately. Running out of money never got in the way. If the account has only 100 units of capital and must pay trading costs, we first need to agree on how that money is used and how trades are executed.
That's what we'll settle in the next lesson.
Complete reference task — give this to AI when you're ready
You don't need to memorize these formulas. The explanation above helps you understand the question; the task below gives your AI the precise version. You can also work through it over several conversations and ask the AI to summarize the agreement. Nobody expects you to write a task this complete on the first try.
Ready to run it? Expand and copy the complete reference task
Reference experiment — copy and use
Actually run an exit-rule comparison in this project. Save the program, event-level records, a plain-language summary, and a chart comparing three rules. First read the saved Nine-Beat definition, eligible-company list, entry handoff, and data locations. Ask me for missing prerequisite records rather than inventing a different Nine-Beat or eligibility rule.
Restate my current entry choice first. If it differs from the reference route below, ask whether to continue my route or create a separate reference experiment; do not overwrite my choice. The reference route uses the frozen 292 eligible fictional companies and retains completed falling Nine-Beat events only where companies.parquet has industry_id = PY-10 (Mobility Networks). Confirm count 9 at the close and enter at adjusted_open of that stock's next valid daily bar. Use prices and indicators only from 2021-01-04 through 2022-12-30. Do not read or calculate 2023 prices, indicators, signals, or returns. Do not rerun eligibility screening across periods. Do not add capital, fees, slippage, or index comparisons.
The entry bar counts as bar 1. Count only the stock's own valid daily bars. Compare these three exits separately; do not combine them:
- 10-bar baseline: exit at
adjusted_closeof bar 10. - MACD exit: observe each close from holding bar 1 through bar 19. After the first
H[t] < H[t-1], exit atadjusted_openof the next valid daily bar. Equality does not trigger. Do not require a zero-line crossing, bullish crossover, or an earlier rise. Use adjusted closes:EMA12 = adjusted_close.ewm(span=12, adjust=False, min_periods=12).mean()andEMA26 = adjusted_close.ewm(span=26, adjust=False, min_periods=26).mean(). SetDIF = EMA12 - EMA26,DEA = DIF.ewm(span=9, adjust=False, min_periods=9).mean(), andH = DIF - DEA. Compute along each stock's research-period history; do not reset at each entry. - Volume exit: use the same observation and execution timing. After the first
R[t] < 0.8, exit at the next open. Equality at 0.8 does not trigger.R[t]is today'strading_volume_sharesdivided by the average over the previous twenty valid daily bars, excluding today.
For both indicator rules, if no trigger appears, exit at bar 20's close. A trigger at bar 19's close means an exit at bar 20's open and takes precedence over the closing fallback. Do not observe bar 20's close and then pretend to exit at its earlier open. If two MACD histogram values cannot be compared, or relative volume has insufficient history, missing required values, or a nonpositive denominator, mark that observation as unjudgeable and continue. Do not fill invented values or delete the event for missing indicators. A pre-entry trigger is not an instruction to exit after entry.
Starting from the frozen entry events, select a common sample with twenty complete valid bars from entry within the research period, finite required open and close prices throughout those bars, and a positive entry price. Use exactly that sample for all three rules. Report the original event count, previous 10-bar count, common-sample count, and exclusion reasons. If adjusted prices are zero or negative, check the field convention and explain before proceeding; do not automatically change prices. Recalculate the common sample's 10-bar result rather than reusing a summary from another sample. If coverage is below 100 events, 10 companies, or 50 signal-completion dates, report it and pause selection. Do not use 2023 to complete windows. These are historical comparison criteria, not live entry conditions.
Calculate each event separately as exit price / entry price - 1. Keep overlapping same-stock or same-day events as separate records, but do not claim statistical independence. Save entry and exit dates and prices, trigger dates, exit reasons, holding-bar counts, and returns. Report event count, mean return, median return, positive-return share, and mean and median holding bars for all three rules. For the indicator rules, also report trigger and time-cap exit counts and how many events encountered unjudgeable indicators along their actual observation paths. Do not treat event returns as account returns or mechanically annualize them.
Selection criteria: relative to the common sample's 10-bar baseline, a candidate must improve median return by at least 0.20 percentage points without lowering mean return or positive-return share. Compare unrounded values. If both pass, prefer the higher median, then shorter mean holding time, then higher positive-return share; if still tied, prefer MACD. If neither passes, retain ten bars. Do not search additional parameters or automatically change the final choice in the research handoff.
Check first-trigger handling, next-bar execution, equality, missing indicators, a bar-19 trigger, and the bar-20 fallback yourself. After actually running the program, explain the results in plain language and report whether implementation checks passed. Do not alter results to match example numbers. Stop here: no account simulation and no holdout access.
If something looks wrong, you can follow up with:
Check an unexpected result
Check whether the program faithfully implemented the three-rule specification I provided, especially the entry list, common sample, indicator definitions, and exit timing. Identify the earliest mismatch and cite actual files or event records. Without an external reference table, do not assume you know the course's numbers. Do not classify disappointing returns as a software error. If you confirm an implementation error, explain the smallest fix and rerun the original rules, preserving the earlier record. If this is my own custom version, explain the differences instead of forcing it into the reference version. Keep 2023 sealed.
Lesson discussion
Share a question, insight, or different view—and see how other learners are thinking.