Lesson 2
We Have Trading Rules. Why Can't We Backtest Yet?
Define capital use, competing entries, costs, slippage, and end-of-period valuation before running an account simulation.
Hoppy saves the fixed 10-bar exit rule and takes another look at the previous lesson's results.
“If I start with 100 units and follow these rules, how much would I make?”
“That table can't tell us yet,” says Dr. Hop.
“We've tested when to buy. We've tested when to sell. What's missing?”
Instead of answering, Dr. Hop writes down a little example.
On Monday, the first entry opportunity appears. Hoppy puts his money into the trade.
On Tuesday, another opportunity arrives.
“What would you use to buy the second one?”
“The money from selling the first?”
“But it isn't time to exit that trade yet.”
Hoppy looks at the two opportunities, then at his one pot of money.
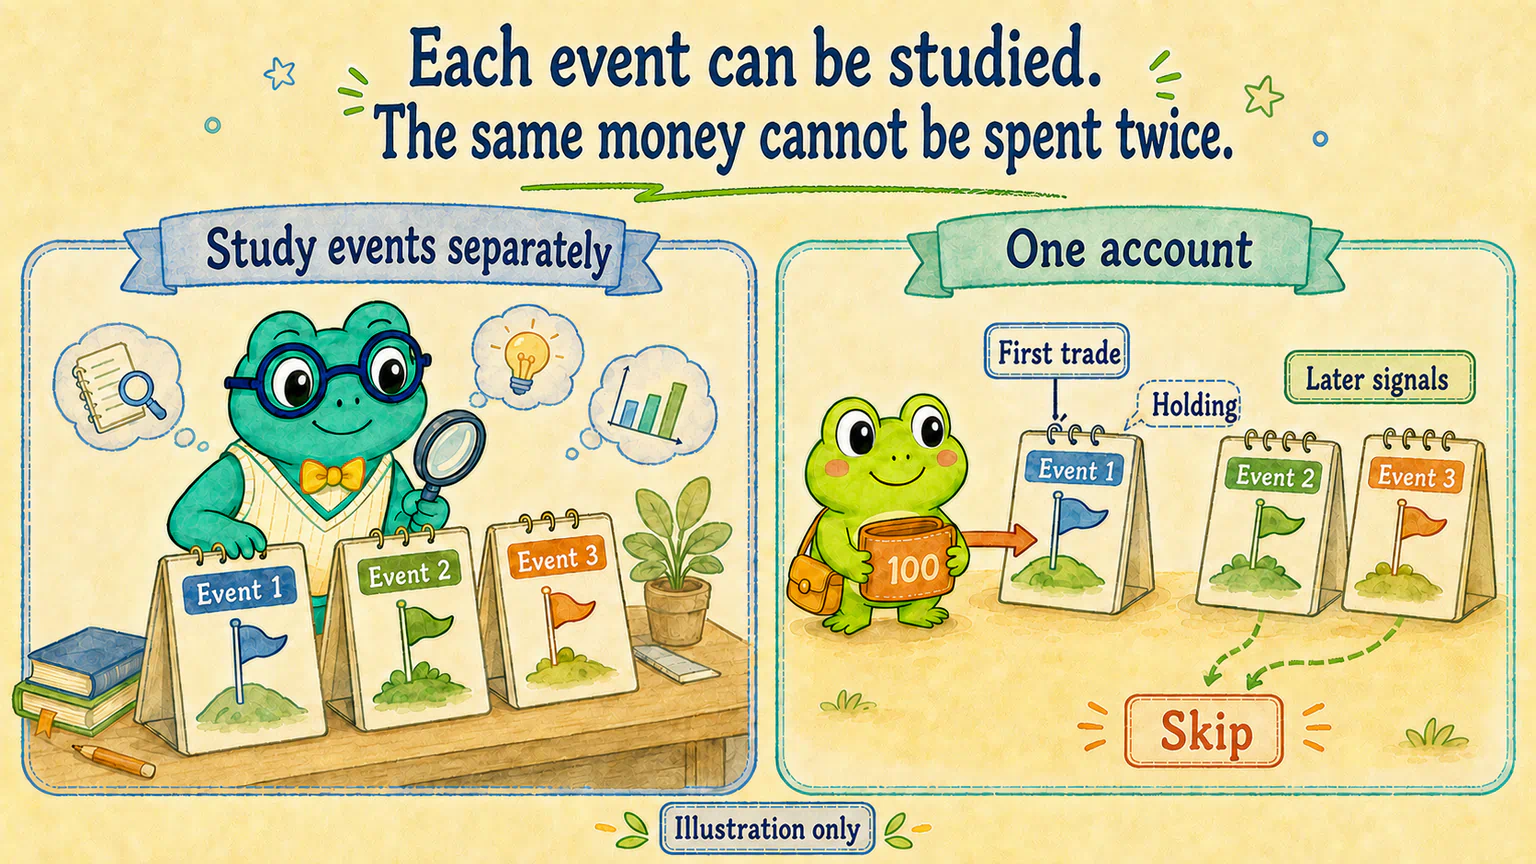
A table can include every opportunity. The same money can't be in two places at once.
Before, we studied each opportunity. Now we follow the money.
Until now, we took each Nine-Beat event separately: suppose we entered at the agreed time and exited according to the rule. Did that event make or lose money?
After calculating all the events, we looked at the mean return, median return, and share with positive returns.
That was useful. It helped us examine what happened after Nine-Beat events, compare entry filters, and compare exit rules.
But it left another question unanswered: could one account actually carry out all those trades?
Several signals might arrive on the same day. A new opportunity might appear before an earlier trade has closed. An event table can calculate them all; an account has to check whether any money is available.
So the earlier mean return doesn't directly answer, “What would my 100 units become?” It isn't the result of that money moving through a sequence of trades.
Now we're asking:
With one limited pot of money, what would be left after following our agreed trading rules through time?
To answer, we need to simulate an account: when it holds cash, when it holds a stock, when the money comes back, and how it can enter the next opportunity.
Walking through those decisions in historical date order is the account backtest we're preparing to run.
We won't split the 100 units into smaller pots
“Couldn't I divide the money and buy several stocks?” Hoppy asks.
You could. That would be another way to allocate capital.
For now, we'll use the simplest version: no split capital, and only one stock held at a time.
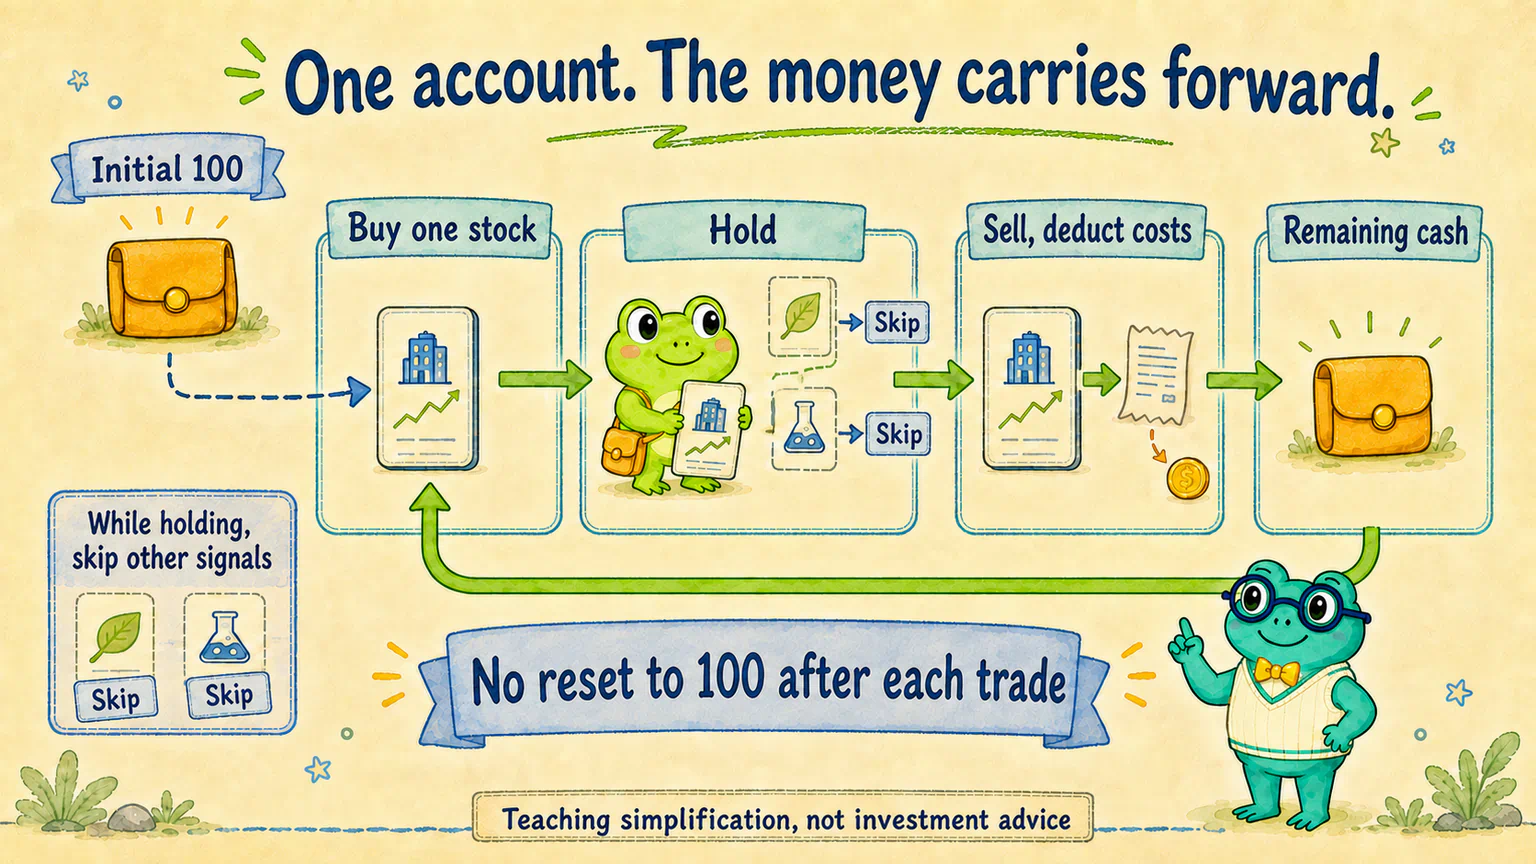
The account starts with 100 units of cash, no stock, and no borrowing.
When it holds no stock and an eligible opportunity appears, it uses its available cash for that trade, allowing for the purchase fee. While holding, it buys no other stock and doesn't add to the existing position.
After selling under the agreed rule and deducting the relevant costs, it uses whatever money remains to wait for the next opportunity. With no opportunity, it holds cash.
Notice: whatever remains, not a fresh 100 units every time.
Here's an example just to explain the money flow. If one completed trade leaves 105 units, the next round starts from 105. If only 95 remain, it starts from 95. The account doesn't quietly reset after a loss.
Nor can it hold a stock while treating that stock's current value as a second pot of cash to spend again.
The 100 units are a convenient starting scale, not 100 real yuan or dollars. We aren't bringing in every market's trading-lot sizes and minimum charges, or designing an allocation across several stocks.
This is a simplified teaching setup, not advice to put all your real money into one stock.
When money is limited, you can't choose after seeing the winners
Holding one stock at a time makes things simpler, but a few questions remain.
Suppose the account holds only cash and three eligible opportunities appear on the same day.
“Buy the one that goes up the most afterward?”
Hoppy laughs before anyone answers.
That's something you know after seeing the later data, not a choice you could make before buying.
We need a method agreed in advance. For example, sort the stock codes in a fixed order and take the first one. That doesn't mean a company with an earlier code is better. It simply gives the program a definite way to handle simultaneous opportunities.
We can discuss which simple method to use. But we can't inspect three return curves and then pretend we knew which choice to make from the start.
What if the money is already in the first trade when another signal appears?
Under our no-split rule, skip it. Don't put it on a tab and buy later at a price from several days ago.
Queuing missed opportunities until money becomes available would change the entry timing we've already fixed. That would be a different idea to research.
The order of selling and buying matters too. Our reference exit is at the close of the tenth valid daily bar. That sale's proceeds plainly weren't available earlier that morning, so they can't fund a purchase at that morning's open.
You don't need to memorize a long rulebook. Just follow the money and ask: at this moment, is it still a stock, or is it cash we can actually use?
Trading also costs a little money
The event study mainly compared entry and exit prices. The account backtest also needs to allow for trading costs.
Start with two simple ideas.
One is transaction fees. Buying and selling may cost money. Once paid, that money is no longer in the account. A purchase must allow for its fee too: we can't spend all the cash on shares, then invent extra money to pay the charge.
The other is a difference in the execution price. The reference price on a chart isn't necessarily the price you could actually buy or sell at. For our simulation, we can make a simple assumption: purchases cost a little more than the reference price, and sales receive a little less. A difference between an execution price and a reference price is commonly called slippage.
We aren't researching how to minimize costs here. We'll agree on a set of teaching assumptions and have the AI apply them consistently to each trade.
Write down the numbers and how they apply on both sides. Don't remove costs because the results look disappointing, or present a teaching assumption as the actual fee schedule for every market and account.
For now, understand that these costs reduce what the account has left. We'll see how much they matter after the account has actually run.
Why compare with the CSI 300 this time?
Hoppy remembers something.
“Weren't we comparing with random dates? Why change the comparison?”
Because we're asking a different question.
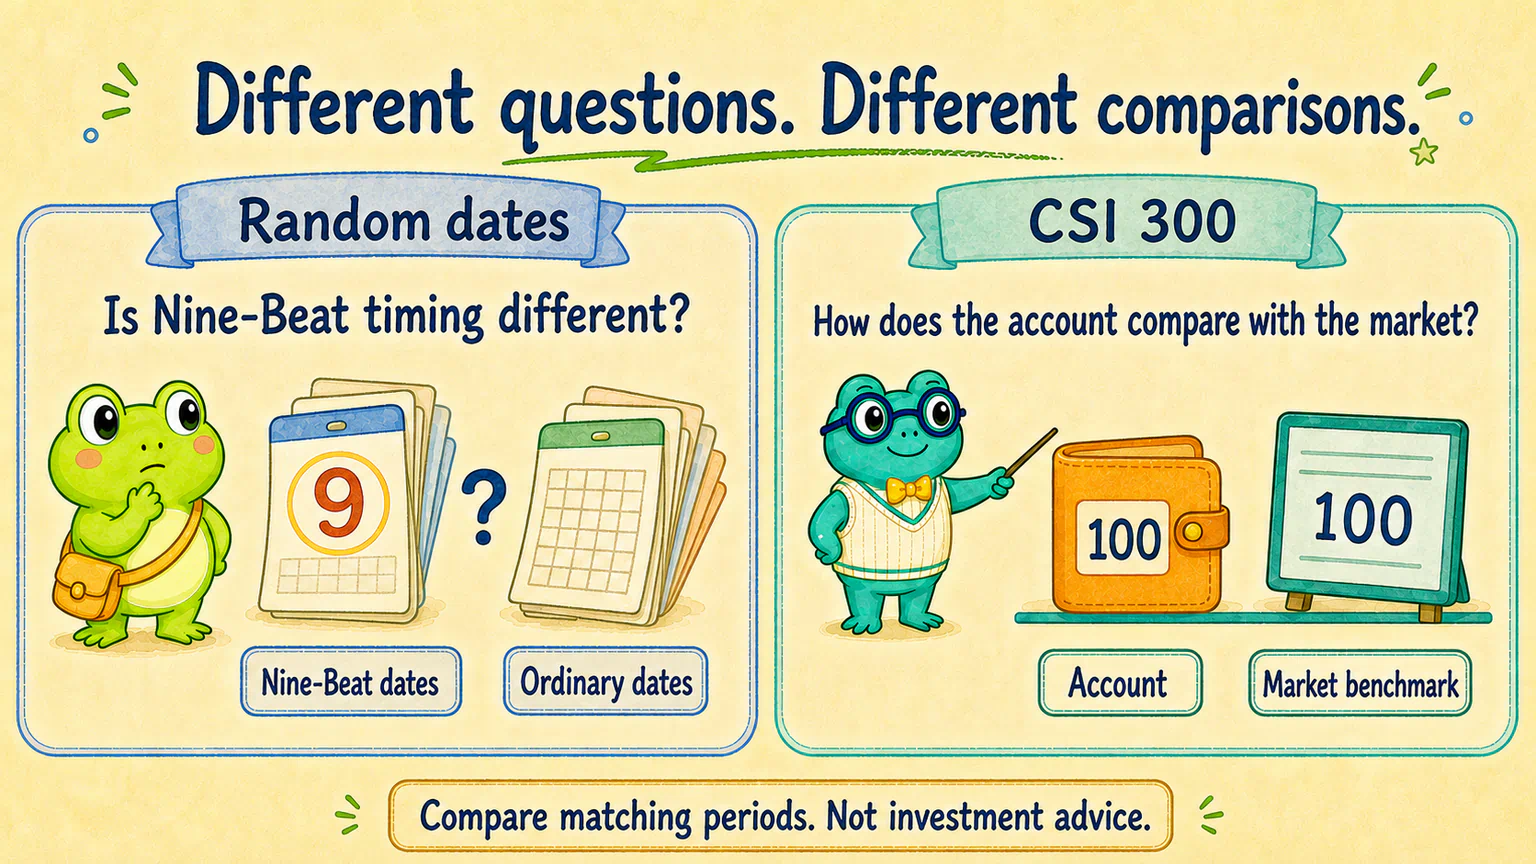
With random dates, we wanted to know: is the completion of a Nine-Beat Count a more distinctive time than an ordinary date?
Now we have trading rules and are preparing to simulate limited capital. Alongside asking whether the account makes money, we want to know: after all this choosing, waiting, and trading, how does it perform relative to a market reference over the same period?
That's why we use the CSI 300 as the common benchmark for this experiment. Think of a benchmark as something to measure against.
We continue with the same fictional teaching dataset and A-share case used in the Chinese lessons. CSI 300 is the English name used here for 沪深300. This is not a separate US-market experiment, and the fictional companies are not real investment targets.
Consider a hypothetical example—not our backtest result.
An account goes from 100 to 105 units, earning 5%. If the CSI 300 rises 15% over the same period, the account makes money but trails the benchmark by 10 percentage points.
Now suppose the account loses 5% while the index falls 10%. The account loses less than the index, but its owner still has less money.
“Did I make money?” and “Did I beat the benchmark?” are different questions. Both matter.
On a chart, we can start both lines at 100 and use matching start and end points. One follows the account's value. The other follows the CSI 300's change relative to its starting level.
We're not comparing the account's 100 units directly with the index's original level of several thousand points.
Nor does the index line mean we actually placed an order for an “index account.” It's a reference for comparison. We need to state the data field and return convention we use for it.
The CSI 300 gives this experiment one consistent market reference; it isn't the right benchmark for every strategy. Our reference route selects just one teaching industry, so its composition differs from the index. Even if the account eventually wins, that curve alone won't establish that Nine-Beat timing deserves the credit.
What if Hoppy starts a few days later?
Hoppy looks back at the opening example and has another question.
“If I hadn't started on Monday, and only arrived with my money on Tuesday, could I take the second opportunity instead?”
Possibly.
The earlier starter might already have money committed to the first trade. The later starter might still hold cash. Even with identical trading rules, they could participate in different opportunities afterward.
That reminds us: one account's fortunate timing might not represent what the rules usually produce.
So we'll add a small check alongside our main account: start ten accounts on staggered dates and see how different their results are.
Imagine ten people, each with 100 units, following identical trading and fee rules but starting on different days. Their money stays separate. They don't lend to one another or pool it into a larger account.
This is not splitting 100 units ten ways, or one person holding ten stocks. Each account still holds only one stock at a time.
Set the schedule first: the first account starts on the research period's first market trading day; the second starts two market trading days later; the third starts another two days after that; and so on, for ten accounts. All end at the same research-period endpoint.
“Starting” means being ready to wait for an eligible opportunity, not having to buy something that day. Nine-Beat Counts still use history already available at the time. A new account doesn't reset a stock's earlier count.
The two-trading-day spacing is a convention for this teaching check, not a discovery of the best starting rhythm. Don't move the dates to nicer-looking places after seeing the results.
And don't call this ten independent validations. The accounts experience much of the same market history and may take many of the same trades. If no eligible entries occur during those initial gaps, they might even enter their first trade on the same day and produce identical results. Report that as it is. You can later add a separate run with a wider range of starts, but write down its schedule before running it and keep the original results. Don't overwrite the earlier record or keep moving dates until the curves look the way you want.
This check asks a smaller, practical question: across these starting dates, does the account's performance depend heavily on the day it begins? It can't eliminate every kind of luck or replace the later holdout check.
In the next lesson, we'll first follow the earliest account through its trades, then put all ten results in one simple comparison chart. Alongside the median, we'll look at the best-to-worst range and how many beat their own same-period CSI 300 benchmark. We won't report just a mean, or show only the most profitable account.
Because the starts differ, each account needs an index reference for its own start-to-end period, not the earliest account's index return applied to everyone. When comparing the accounts, remember that their observation lengths differ slightly too.
These summaries describe ten starting arrangements. Even if eight accounts out of ten outperform, that doesn't mean an 80% chance of outperforming in the future.
Ask AI to turn the discussion into an account rule card
We haven't found another indicator. We've added instructions for using the money to the trading rules we already had.
Open your research project and ask Codex to read the handoff saved in the previous lesson. WorkBuddy is an alternative if you can't use Codex. In a new conversation, tell it where the file is. It doesn't need to know the course title, but it does need your actual agreed rules.
You can start with this:
Ask your AI research assistant
Read this project's research handoff and restate the entry and exit rules already chosen. Ask me for missing prerequisite records. Do not choose a new strategy or guess my choices.
Help me prepare an account rule card for a historical backtest. Start with 100 units of cash, no added funds and no borrowing. Do not split capital; hold only one stock at a time. When the account holds no stock, use available cash to enter according to the existing rules, allowing for purchase fees. While holding, do not add to the position or take other signals, and do not queue missed signals for later purchases. After selling and deducting costs, use the remaining money for subsequent opportunities. Hold cash when there is no opportunity.
Check which execution choices remain unclear, including how to choose among same-day opportunities, when sale proceeds can fund another purchase, and how to set fees and slippage. Explain with simple examples and suggest an easy-to-execute teaching assumption for each unresolved item. Ask for my confirmation rather than marking it frozen yourself. Keep existing explicit agreements without asking the same questions again.
We plan to run accounts in 2021–2022 and compare them with the CSI 300 over matching periods, with both lines starting at 100. Also work through end-of-period open positions, missing price records, index data conventions, and how a future validation-period account should begin. List real trading restrictions unsupported by the data as teaching simplifications rather than inventing information. In particular, do not treat the previous exit comparison's list of events with complete twenty-bar windows as the account's list of permissible entries.
Add the staggered-start check to the same card: ten simulated accounts with no money transfers between them, each starting with 100 units of cash and no stock. Trading, capital-use, and cost rules must be identical. Relative to the research period's first market trading day, start at offsets of 0, 2, 4, 6, 8, 10, 12, 14, 16, and 18 market trading days. End all accounts at the research-period endpoint. Fix the first account as the main example; do not choose it by return. Each account may participate only from its start onward, at the original entry times. Do not force a start-day trade or catch up on missed entries. Compute Nine-Beat Counts and indicators from history already available before the decision, without resetting at account startup.
Compare each account with the CSI 300 over its own start-to-end period. Record the matching dates and the convention for rebasing to 100. When we eventually run this, preserve all ten results and trade paths, including duplicates. Report the median account return, best and worst, and how many exceed their own same-period benchmark. Do not combine them into a portfolio or treat them as ten independent validations or a future win probability. For now, only specify these requirements; do not generate results. If we later explore a wider range of starts, save that additional schedule before running it, preserving these rules and any existing results. Do not overwrite earlier records or repeatedly move starts to get a preferred outcome.
This step is only for checking existing records, discussing choices, and preparing the rules. Do not run a backtest, calculate account returns, or read or calculate any 2023 prices, indicators, signals, or returns. Separate agreed items from items awaiting confirmation, and preserve the original handoff.
You can give this task directly to AI without memorizing every rule. You're checking how it plans to use the money, not designing the program yourself.
If the AI gets too technical, say: “Leave the program design aside for now. Show me one trade so I can understand the difference between these choices.”
Walk through the rules before running the account
Once the rule card is organized, don't rush the AI into drawing a return curve.
First, have it walk through a few small scenarios and check for conflicting instructions.
Check the work with AI
Using the account rule card we just prepared, walk through three scenarios: two eligible entries arrive while the account holds only cash; a new signal arrives while it already holds a stock; and it sells at the close on a day that also had an entry signal at the open. These are rule illustrations, not measured results. Explain what the account would and would not do. Check that it neither spends the same money twice nor uses information unavailable at the decision time.
Also explain this case: two staggered accounts wait until the same date for their first eligible entry. Do the rules allow them to take the same trade and produce identical results? Check that each starts with its own 100 units, offsets count market trading days, indicator history isn't cut off at account startup, and each uses a benchmark over a matching period.
If the rule card cannot answer a scenario yet, identify what needs confirmation rather than filling in rules on the fly. After I confirm, save an account research handoff and note that the backtest has not run and 2023 remains sealed.
This time, “finished” doesn't mean “we calculated a profit.”
It means that when these situations arise, you and the AI can explain what the account will do next under the agreement.
After reading the walkthrough, Hoppy realizes something.
The earlier table wasn't wrong. It was answering a different question.
Now the 100 units have a sequence to follow: buy, wait, sell, and continue. We don't yet know how many opportunities will be missed, how much costs will take, or how much money will be left.
But at least we won't be deciding how to calculate the result while looking at the curve.
“What about the ones who start a few days later?” Hoppy asks.
We'll include them too. Just not by filling the screen with ten lines straight away.
Next, we'll follow one account to understand the process, then see whether the other nine staggered starts lead to different outcomes.
Lesson discussion
Share a question, insight, or different view—and see how other learners are thinking.