Lesson 4
Why Doesn't the Account Return Match the Event Average?
Separate event averages, account profit, and index-relative performance while tracing how limited capital and trade order change the journey.
Hoppy circled two lines in the summary from the previous lesson.
“Beat the CSI 300 by 20.52 percentage points.”
“Account return: −5.21%.”
“Am I supposed to feel good about this or not?”
“Neither line is judging you,” said Dr. Hop. “One compares your account with the market. The other compares it with your starting 100 units.”
Our primary account went from 100 to 94.79 units. It lost money. The index fell 25.73% over the same period, so the account also outperformed its reference by falling less.
Both statements can be true.
But something else was bothering Hoppy.
“When we looked at those Nine-Beat opportunities one by one, wasn't the average return pretty good? Why did the account end up losing money?”
Let's start there. No new indicators and no rule changes. We'll open the saved trade records and see where the money actually went.
An opportunity arrives—but the money is already busy
Look at the primary account's first actual trade.
On February 1, 2021, it bought the fictional company Skybrook Mobility, following our rules.
On February 4, an entry opportunity appeared for Sunpeak Mobility too.
In the earlier event study, we could record both opportunities and calculate each one's return from entry to exit. Their dates could overlap without preventing us from calculating the statistics.
But now the program is running an account.
“Sunpeak qualifies too. Should we buy it?” Hoppy asked.
Check the account: the money is still tied up in Skybrook Mobility. Our rules allow one company at a time. We can't hold a stock and pretend the money invested in it is a second pile of available cash.
So the account skips this opportunity.
Skybrook's trade reaches its tenth valid daily bar and exits at the close on February 19. The remaining cash becomes available from the next market trading day.
That missed Sunpeak entry doesn't wait in a queue. We can't go back and buy it at the old February 4 price either.
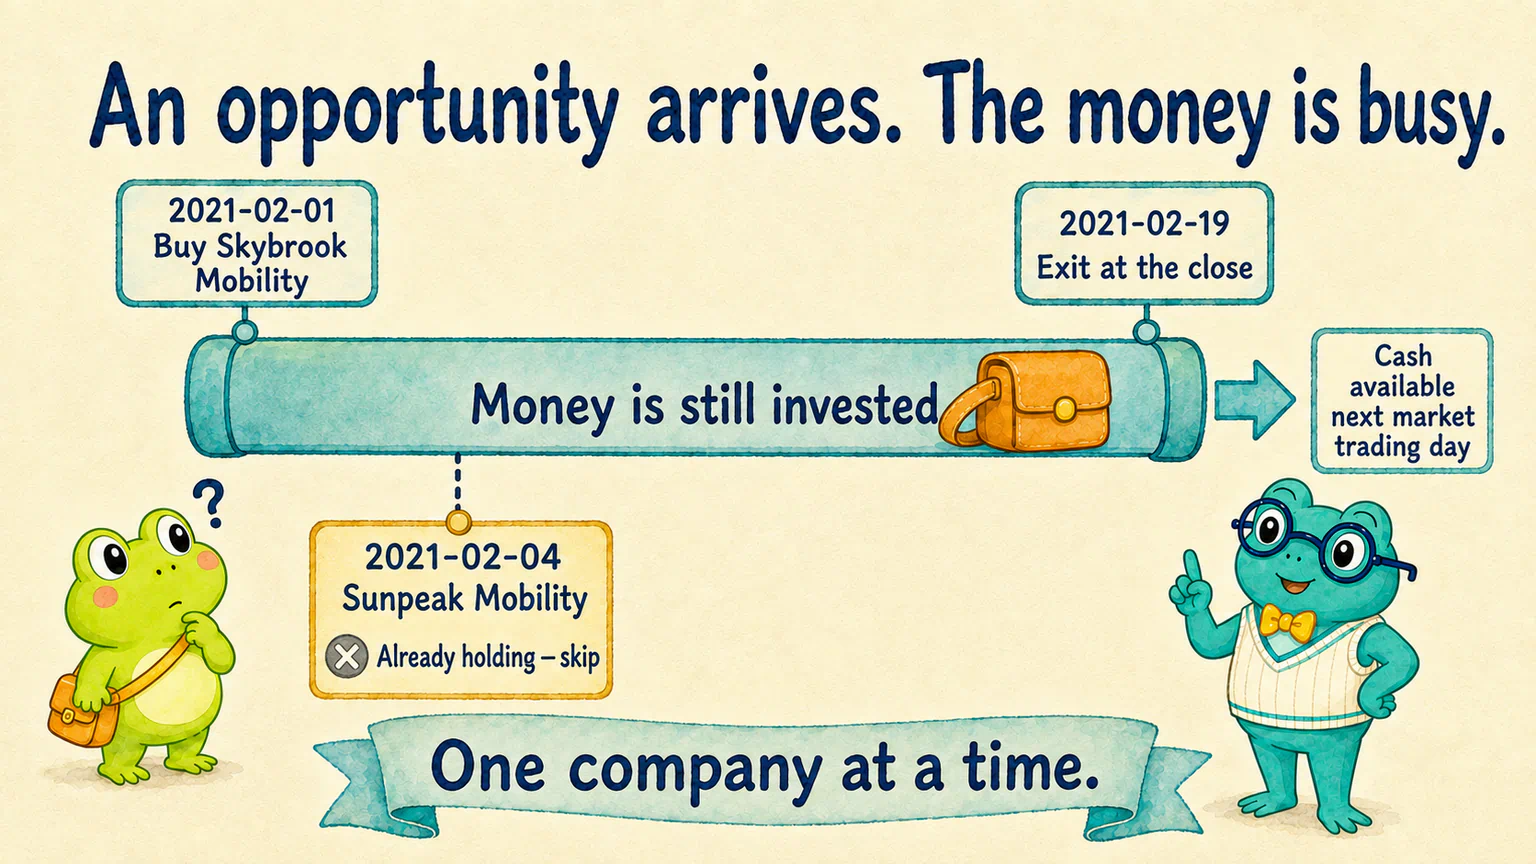
This wasn't a rare interruption. Across the research period, the primary account made 34 entries. It skipped 119 opportunities because it already held a position, and passed over another 9 when multiple entries were available on the same day and the code-order rule selected just one.
An opportunity in the event table is not necessarily a trade the account actually made.
That's why the earlier average event return cannot directly answer, “How much did these 100 units earn?” The account no longer participates in every opportunity in that table.
Hoppy wasn't quite ready to let it go. “So if we'd bought all the ones we missed, would we have made money?”
Not so fast. Some missed opportunities may have lost money. The number skipped doesn't tell us whether skipping them helped or hurt the result.
What we do know is this: limited funds changed which trades the account participated in. We can't work out the exact effect on returns by filling in the gaps with a story.
There's another small distinction. The event comparison included only events with complete observation windows. The account decides whether to buy using information available at the time, and keeps positions that haven't reached their exit by the research end date. The two sets of records don't have to contain the same number of entries.
The next trade uses whatever the last one left behind
Even if we set missed opportunities aside, an account has another important difference from an average.
It doesn't receive a fresh 100 units after every trade.
Here's a small example. This is an arithmetic illustration, not two actual trades from our experiment. Ignore costs for now, and suppose the first trade gains 10% and the next loses 10%.
First trade: 100 units gains 10% and becomes 110.
Second trade: now we're investing 110 units. A 10% loss takes away 11, leaving 99.
“Plus 10% and minus 10%—doesn't that average to zero?”
Yes. But the second 10% is calculated on 110 units, not the original 100.
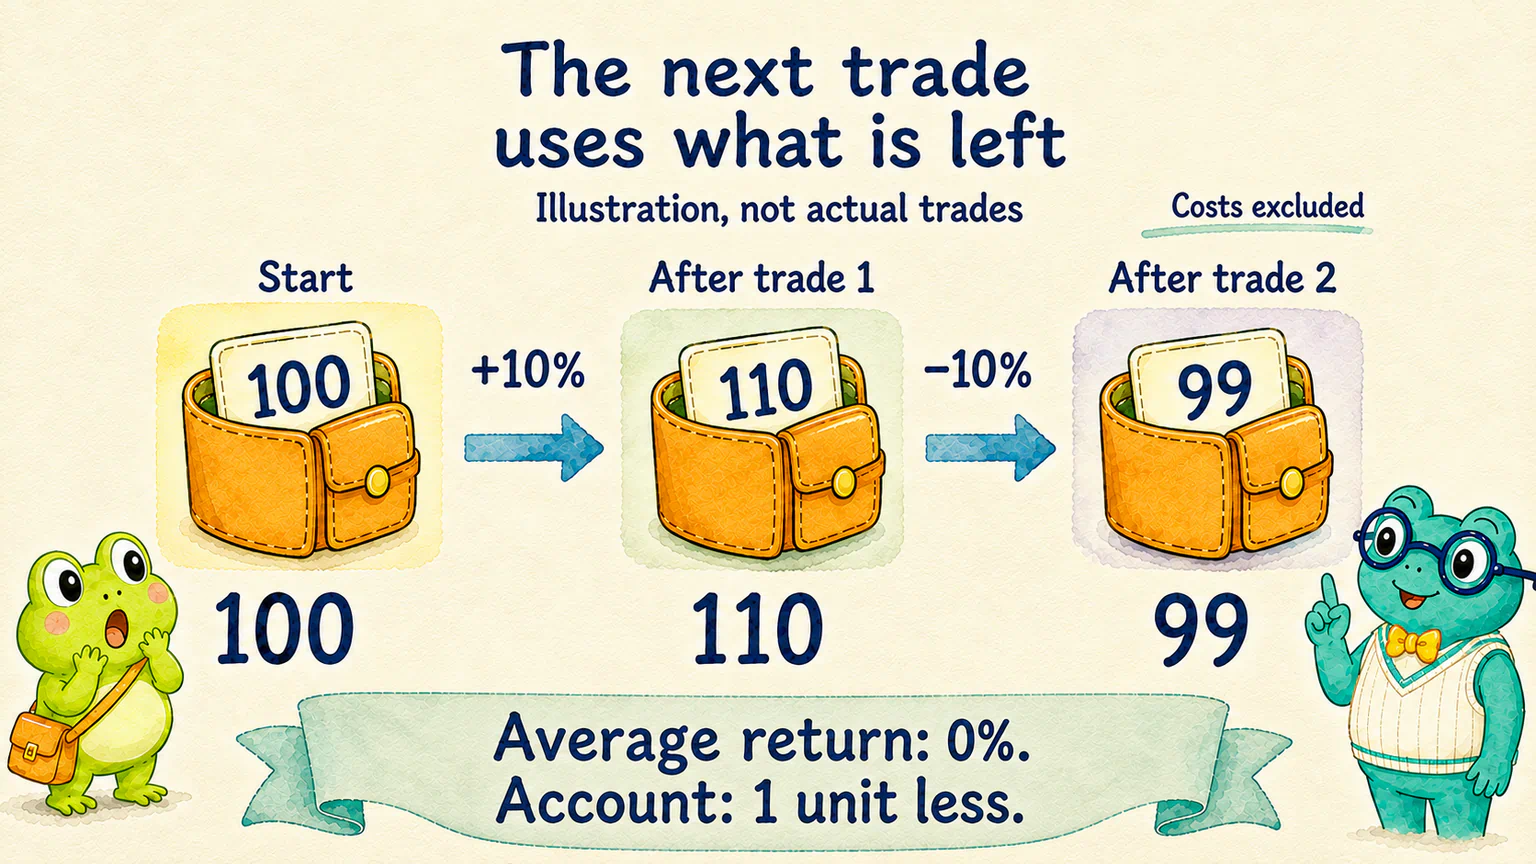
That's what happens as an account moves from one trade to the next. A gain leaves more money for the next trade; a loss leaves less. Later gains and losses apply to whatever money remains at that point.
When the account isn't holding a stock, the money stays in cash. Our teaching rules pay no interest on cash. Extra opportunities appearing in a stock table don't automatically create extra account returns.
So the average event return summarizes the gains and losses of individual opportunities. The account return describes what happened to the same pool of money through its actual sequence of trades.
Both calculations can be correct. They just aren't interchangeable.
Why did those two nearby lines finish over 6 units apart?
Return to the primary account chart from the previous lesson.
One version includes the agreed fees and slippage. The other follows the same trades with both costs set to zero.
We didn't give the zero-cost account extra entries or a different selection of trades. Costs were the only change.
| Same trading path | Ending equity |
|---|---|
| Without fees or slippage | 101.35 units |
| With fees and slippage | 94.79 units |
The difference is about 6.57 units.
“If each charge is tiny, how did the gap get that big?”
Because the money goes through more than one trade.
Fees are deducted from the account. Slippage makes the entry price slightly higher and the exit price slightly lower. By the next trade, available funds have already changed, and later trades continue using that changed amount.
So 6.57 units is the difference in ending equity between the two cost settings—not a bill obtained by adding up all the trading fees.
In this simplified experiment, including fees and slippage took the same trading path from ending just above 100 to ending below it. That doesn't mean the approach would be worth investing in if fees disappeared. Nor does it mean real-world charges match our assumed values.
What we can say is that costs weren't a tiny detail we could safely ignore after calculating returns.
Our earlier question now makes more sense. Before, we counted individual opportunities. The account participates in only some of them, carries its remaining money forward, and pays costs. The two calculations answer different questions, so we can't put an equals sign between their results.
Finishing about 5 units down doesn't mean the journey only dipped that far
Hoppy moved the cursor from the far right of the chart to the drop in the middle.
“I only looked at the final 94.79. I thought the ride had been fairly calm.”
Let's bring up the primary account's daily closing records.
On April 23, 2021, its equity reached about 115.16 units.
By April 28, 2022, it had fallen to about 65.40.
Measured from that earlier high, this was a decline of about 43.21%. It was the primary account's deepest fall from a previous peak to a later low during the research period—its maximum drawdown.
It doesn't mean the account lost 43.21% in one day, or finished the period down 43.21%. It describes a decline the account went through along the way.
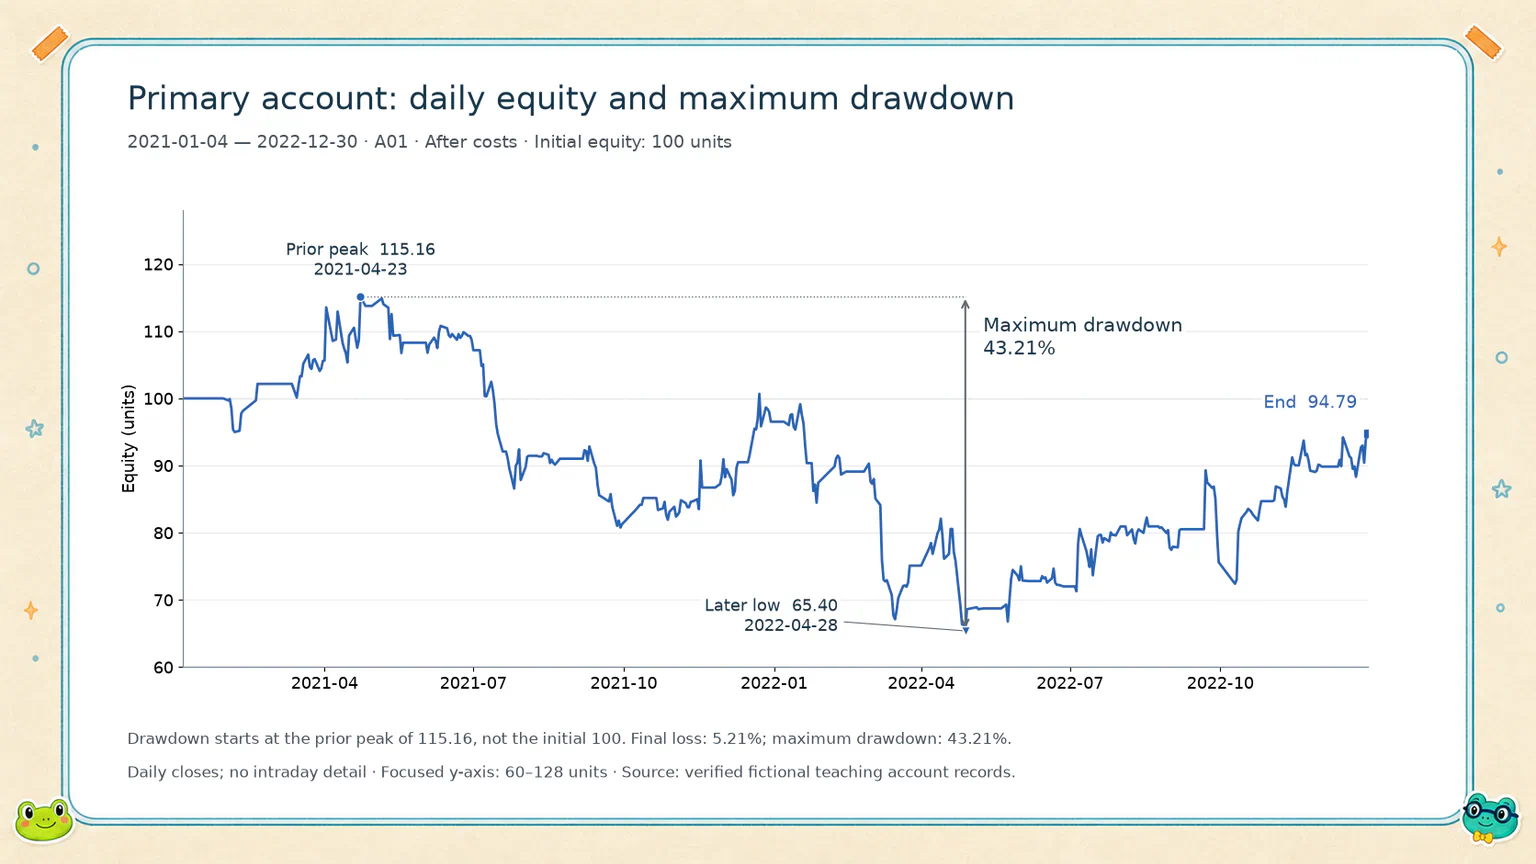
The account later recovered to 94.79. That doesn't erase the earlier fall from its history.
That's why the final return alone isn't enough to understand an equity curve.
Here, drawdown is calculated using equity at each daily close. Our daily-frequency experiment doesn't fully show the finer movements within each day.
You don't need a whole collection of risk measures yet. Being able to separate “how much was left at the end” from “how far it fell along the way” already reveals something important that the final number alone cannot.
Starting later can mean a different journey
After looking at the primary account, return to the other nine.
All started with 100 units and followed the same rules. But in the run with starts spaced ten market trading days apart, the highest return was −5.21%, the lowest was −17.06%, and the median was −9.37%.
That tells us the primary account's result wasn't the only outcome under this set of starts. Beginning to wait for entries at another time can lead to a different first purchase—and possibly a different set of later trades.
But don't mistake ten accounts for ten completely different experiences.
For example, A03 started on February 1 and A04 on February 22. Their first purchases differed, as did their complete trading paths, but they still shared 33 entry events.
Two separate ledgers, with many later pages recording the same trades.
Also, every account ended on the same date. A later start meant experiencing less of the market history. The difference isn't just a measure of luck from starting a little earlier or later. Ranking final returns doesn't establish a best start date.
All ten accounts beat their own same-period index references. That's an honest description of this run—not a promise of future outperformance.
The staggered-start check helps us look beyond one start date and one ledger. It shows us several journeys. It doesn't predict the future for us.
Ask AI to explain your ledger too
If you used your own filter, or your local account produced different results, don't force our explanation onto it.
You can keep asking questions in Codex or WorkBuddy. Ask it to find evidence in your records, not invent a plausible-sounding story.
Optional conversation
Read the completed 2021–2022 account backtest summary, trade records, and daily equity records in this project, and help me understand the results. First briefly confirm the rules I actually used. If you can't find the files, ask me to provide them. Don't assume you know the course example.
Using actual records and plain language, explain how the opportunities the account participated in differ from the earlier event study; whether fees and slippage changed the outcome; and what the final return and deepest decline were, including what each means. If there are staggered-start accounts, explain which experiences they share and which differ. Without a zero-cost comparison following the same trading path, say that you cannot precisely isolate the cost effect; don't invent a difference. If the records don't support an explanation, say so. Don't attribute every difference to one cause.
Explain only saved results. Don't search parameters, run new strategy experiments, or read 2023 prices, indicators, signals, or returns. Add a short explanation to the existing research summary while preserving its original numbers. If I don't understand, walk me through one actual trade.
You don't need a report packed with terminology. Explaining from the records why the account took one entry, skipped another, and ended where it did is more useful than reciting a list of metric names.
We understand this stretch. What about the next one?
Hoppy finally separated the two tables.
One summarizes opportunities. The other records the journey of the same pool of money. Neither has to be wrong: they answer different questions.
We've also seen that this path beat the index during the research period without making a profit. Beyond the final number were declines along the way, trading costs, and different experiences from different starts.
Those are research findings worth keeping. We don't need to rewrite them to give the story a happier ending.
But one question remains.
We chose the entry filter and exit rule by looking at this research period. We've now specified how the account uses its money and run it through that period too.
What happens if we keep the rules unchanged and move to data that wasn't used to choose them?
Next, we'll take the agreed setup and open the 2023 envelope.
Lesson discussion
Share a question, insight, or different view—and see how other learners are thinking.