Lesson 3
What Happens When We Start with Just 100 Units?
Run limited capital through the frozen rules day by day, producing an account curve, trade records, and an inspectable summary.
Hoppy reaches the last line of the account rule card.
What to buy, when to sell, what to do when the money is tied up: it's all there.
“Can we finally see how much is left at the end?”
“Yes,” says Dr. Hop. “Give AI the rules and let it run them.”
Hoppy types: “Work out how much I'd make.”
Then adds: “Tell me if I'd lose money, too.”
This time, we're finally putting those 100 units to work. We aren't placing real orders. We're asking a program to move through historical dates and simulate trades under our agreed rules.
We want more than “it made money” or “it lost money.” We want an equity curve showing the account's value over time, trade records we can check, and a results summary we can actually read.
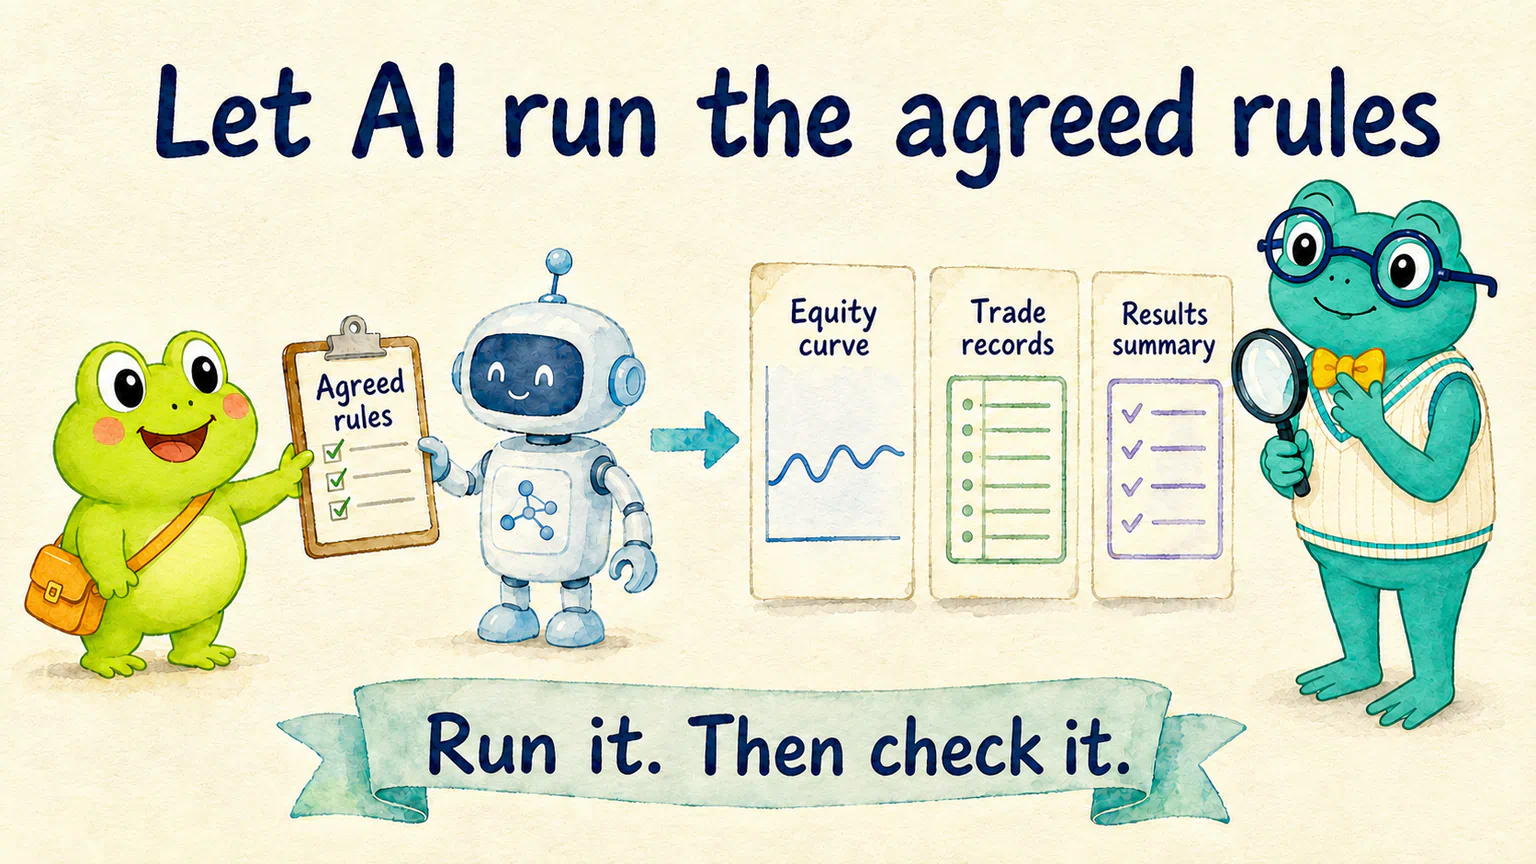
Bring AI back into your research
Open your existing research project in Codex. WorkBuddy is an alternative.
You don't need to retell every previous conversation. Ask AI to read the trading rules and account rule card you saved. In a new conversation, attach those files or tell it where to find them.
The course reference still uses downward Nine-Beat Count completions in the fictional PY-10 “Mobility Networks” industry. Enter at the next valid daily bar's open, count the entry day as bar 1, and exit at bar 10's close. Each account starts with 100 units and holds only one company at a time.
The holding period counts the individual stock's valid daily bars. The gaps between account starts below count market trading days. They are two separate schedules.
We continue with the same fictional teaching companies and the CSI 300 market reference used in our China A-share-based example. The research approach can travel across markets; trading rules and data conventions may not. We are not switching to US stocks in the English edition. The 100 units are a teaching scale, not a real currency balance.
If you kept your own entry filter or exit rule, you can keep using it. Ask AI which version it will run. Don't let your choice quietly get replaced.
There's also one update to the starting schedule from the previous lesson.
When do the ten accounts start this time?
Previously, we agreed to start a new account every two market trading days.
We actually ran that experiment, and something a little funny happened. The accounts arrived at different times, but none found an eligible entry. By the time the first opportunity appeared, all ten were there. They entered together and followed the same trades afterward.
The program hadn't simply copied one result ten times.
After preserving that run, we added another experiment: start a new account every ten market trading days, at offsets of 0, 10, 20, …, 90 trading days. Everything except the starting schedule stayed the same. We didn't keep trying dates until we got ten different curves.
This is an exploratory run added after seeing the first results, not a replacement for the original check.
The results below come from that additional run. You can use this schedule directly; you don't have to rerun the two-day version just to follow along. If you already ran it, keep those results and save the new version separately.
This schedule starts the accounts between January 4 and May 21, 2021. They all finish on December 30, 2022. Later accounts experience a shorter stretch of the market. These are not ten independent validations, and they do not remove luck. This is an additional research-period check with a wider range of starts.
Now we can ask AI to prepare the handoff before running.
Ask your AI research assistant
Read the trading rules, account rule card and data-check records already saved in this project. Briefly explain, in plain language, which version you will execute. If essential files are missing, ask me for them. Do not infer rules from filenames, reselect companies or search for a better strategy.
This account backtest covers only 2021-01-04 through 2022-12-30. Do not read, calculate or disclose 2023 prices, indicators, signals or returns. Reuse the confirmed company eligibility and Nine-Beat Count definition without rescanning 2023 data.
For this run, space account starts ten market trading days apart. Ten separate accounts each begin with 100 cash units and no position, at offsets of 0, 10, 20, 30, 40, 50, 60, 70, 80 and 90 market trading days from the first market trading day of the research period. All end at the research-period end. The earliest account is the primary account. If two-day rules or results already exist, preserve them and save this schedule as an additional version. Do not rewrite the history or automatically change the future holdout-period schedule.
Otherwise, keep the rules I have confirmed. Only raise unresolved choices that materially affect the calculation, and explain them with simple examples so I can decide. Don't ask again about settled choices. Preserve my own entry filter or exit rule. Complete this handoff first; do not run the accounts yet.
If AI asks about fees or an open position at the end, and you haven't settled those details, you can use the reference below. If everything is already clear, skip it. There's no need to copy the same rules twice.
Want to use the course parameters? Open the reference agreement
You can give this block directly to AI. It is one teaching setup we chose, not a requirement for every backtest.
Course reference account setup | Copy and use
I have decided to use the following reference setup for this run. Compare it with the local rules and save it as a separate version, preserving earlier records. If the required Nine-Beat Count definition or eligibility list is missing, ask me to provide it rather than inventing one.
Reuse the eligible-company list saved during the earlier data check; the course reference contains 292 companies. Consider only companies whose industry_id is PY-10 (Mobility Networks). Identify completed downward Nine-Beat Counts using the frozen definition. Confirm count 9 at the close, enter at that stock's next valid daily bar's open, count entry day as bar 1, and exit at bar 10's close. Use the 10-bar exit; don't treat a different candidate from an old experiment as the final choice.
Each account starts with 100 cash units and holds one company at a time. Do not split capital, borrow, add funds or add to a position. When flat, if several entries are eligible on the same day, select the first six-character fictional code in ascending string order, keeping leading zeros. While holding, skip new opportunities without queuing them. Continue with the remaining money after each sale; never reset to 100. Cash from a closing sale is available no earlier than the next market trading day's open.
Charge a fee of 0.05% of the actual transaction value on each purchase and sale, with no additional tax or minimum charge. Apply adverse slippage of 0.05% above the reference opening price when buying and 0.05% below the reference closing price when selling. Allow fractional shares. Calculate the quantity as available cash divided by [slippage-adjusted entry price × (1 + entry fee rate)], reserving the fee without overdrawing cash. Cash earns no interest. Do not model round lots or additional dividend cash flows.
Use the teaching dataset's forward-adjusted price fields adjusted_open and adjusted_close. When a stock has no bar, do not trade or increment the holding-bar count; value it at the most recent known close, never a future price. If the exit is not yet due at the period end, retain the position, value it at the last known price and report the valuation date. Do not invent a sale, deduct an exit fee that hasn't occurred, or extend the calculation into 2023. Report required prices that cannot be used in this positive-price fractional-share model instead of silently changing them.
Move through the original research-period Nine-Beat signals chronologically. Do not use the earlier complete 10-bar or 20-bar event samples as the entry whitelist. Eligibility to buy must not depend on knowing that ten future bars will be available. Do not reset Nine-Beat history when an account starts. Only participate when the original scheduled entry falls on or after that account's activation date; do not catch up on missed entry dates.
Use the dates in hs300_daily.parquet from 2021-01-04 through 2022-12-30 as the market calendar. Start ten accounts at offsets of 0, 10, 20, …, 90 market trading days. For each account, normalize its index reference at that account's activation-day open. Each subsequent daily value is 100 × index daily close / index activation-day open, ending at the close on 2022-12-30. Report missing starting prices instead of moving the start. The index is a price reference without transaction costs. Record 100 for the account and its reference before the activation-day open; do not force later closing values back to 100.
These are teaching simplifications on fictional data, not real fee schedules or a complete model of trade execution. Do not read or calculate 2023 prices, indicators, signals or returns, and do not change the future holdout-period agreement.
The rules are ready. Let it actually run
Once AI's description matches your choices and the essential parameters are settled, continue.
You don't need to choose a backtesting framework first or guess how many program files to create. Explain the task and the outputs you need. Let AI handle the technical work.
Ask your AI research assistant
Using the account rules we just confirmed and saved, write and actually run the research-period backtest in this project. Use only prices from 2021-01-04 through 2022-12-30 and the confirmed research records. Do not read or calculate 2023 prices, indicators, signals or returns, and do not search for new parameters.
Use the project's existing Python environment and install required dependencies if missing. Handle execution, ordinary technical debugging and internal calculation checks. Explain in plain language when you need me to act. Do not silently fill in unresolved research choices.
Save three kinds of output:
- Equity curves: first plot the earliest-starting primary account alongside its same-period CSI 300 reference. Also calculate a version with fees and slippage set to zero while holding the trade path fixed. Separately plot the daily median total equity of the ten accounts, with equivalent zero-cost and matched-index-reference medians. Show only dates when all ten have closing records. Do not rebase at the chart's first displayed date, fill in inactive accounts, or compound median daily returns and call that median equity.
- Trade and ledger records: save actual entries, exits, fees, cash, positions, daily total equity and the reasons candidate opportunities were taken or skipped. Retain unfinished positions at the end. Do not require me to organize these records manually.
- A plain-language summary: report the primary account's ending equity, cumulative return, same-period index return, the percentage-point difference, maximum drawdown, entry and completed-trade counts, positive-return share of completed trades, ending position and zero-cost ending value. List all ten accounts' start and end dates, returns and matched index returns. Summarize the median, highest and lowest account returns, the number that exceeded their own index references, and the number of distinct trade paths. Preserve duplicate paths; do not keep changing the start dates.
Generate charts and the summary from the same calculated results, and give me file locations I can open. Save the actual rules, data range and check results, preserving source data and older outputs. Stop after completion. Do not continue optimizing the strategy or open 2023.
This prompt is fairly specific so we can describe the required outputs in one place. You can also break it into a conversation: run the accounts first, then ask for charts and organized records. As long as the rules and the run behind the results stay the same, the conversation doesn't need to match ours.
If AI gives you code but doesn't run it, follow up: “Please actually run this in the project and open the result files for me.”
If an error appears, share the error text or a screenshot. Explain what you had just done and what you see now. You don't need to decode the whole error message before asking, or restart the entire study whenever something breaks.
The chart is here. Now ask AI to check the accounts
A chart means the program produced an output. It doesn't prove that every step followed the agreement.
You don't need to recalculate hundreds of days on a calculator. Ask AI to check the records it actually produced, rather than simply saying “the logic looks fine.”
Check the work with AI
Check the actual program, input range and output records from this run. Was any cash used twice? Does daily total equity equal cash plus the marked value of the position? Do trade dates, valid-bar counts, costs and end-of-period positions follow the confirmed rules? Does each index reference match its account's interval? Does the zero-cost version retain the same trade path? Does the median chart include the same ten accounts every day, and does its endpoint match the account summary?
Spot-check an actual entry, an actual exit and a skipped opportunity, citing the relevant records. If a case didn't occur, say so. Confirm that the price data actually used in this calculation is limited to 2021–2022, then rerun without changing the rules and check that the results agree.
Explain in plain language what passed, what remains unresolved and where the evidence files are. If the implementation is wrong, fix it to follow the original rules and record the correction. If returns are simply poor, do not change the strategy. Do not read 2023 prices during these checks either.
We are checking whether the rules were followed, not asking AI to turn a loss into a profit.
If your local results differ from the examples below, first check whether the data and rules match. Different numbers are normal if you chose your own setup. If the rules are the same, ask AI to find where execution diverged from the agreement. Don't treat the course numbers as a target it must manufacture.
How much is left of our 100 units?
These are results from the course reference setup, already run and checked—not AI's estimate of a possible return. The companies are fictional teaching objects. Neither the data nor the experiment provides investment advice.
First, the primary account: it starts on January 4, 2021 and ends on December 30, 2022.
The 100 units end up at 94.79.
Hoppy takes a look.
“Well, it did tell me about the loss.”
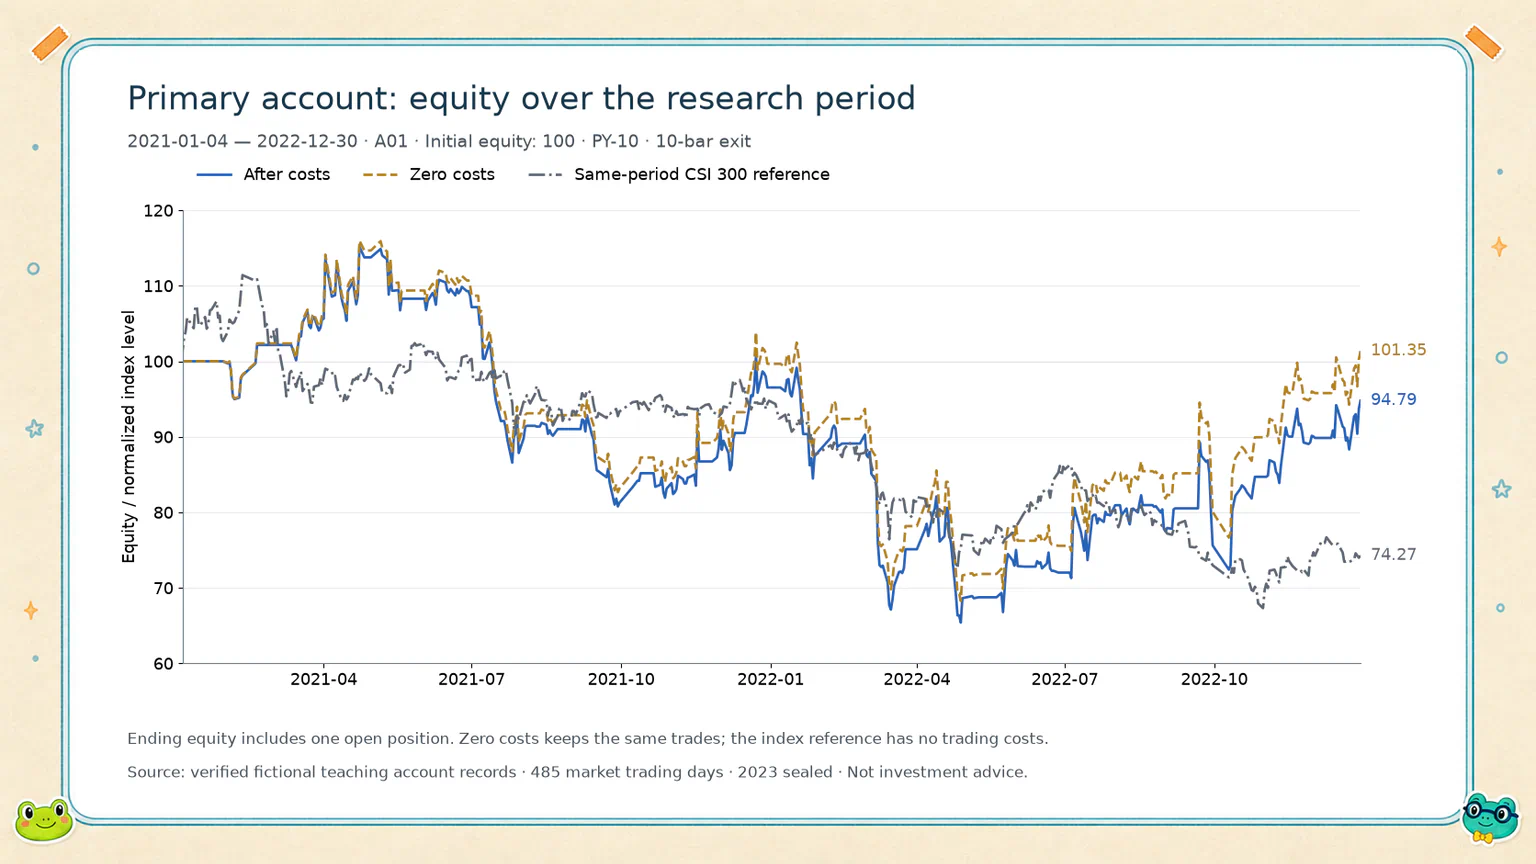
| Primary-account result | This run |
|---|---|
| Ending total equity | 94.79 units |
| Cumulative account return | −5.21% |
| Same-period CSI 300 return | −25.73% |
| Account return minus index return | +20.52 percentage points |
| Ending equity without fees or slippage | 101.35 units |
| Entries / completed exits | 34 / 33 |
One position has not reached its exit date at the end. The 94.79 includes its marked value; it is not all cash received from selling everything.
Keep the curves, numbers and trade records together. The summary also includes measures such as maximum drawdown. If those are unfamiliar, don't get stuck here. We'll use these results to unpack them in the next lesson.
Put the other nine accounts alongside it
Instead of squeezing ten account lines into one chart, we use the median curve we asked AI to produce.
Each day, sort the ten account values from smallest to largest and average the middle two. Connect those daily values. This does not select one particular account, and it does not pool the ten accounts' money.
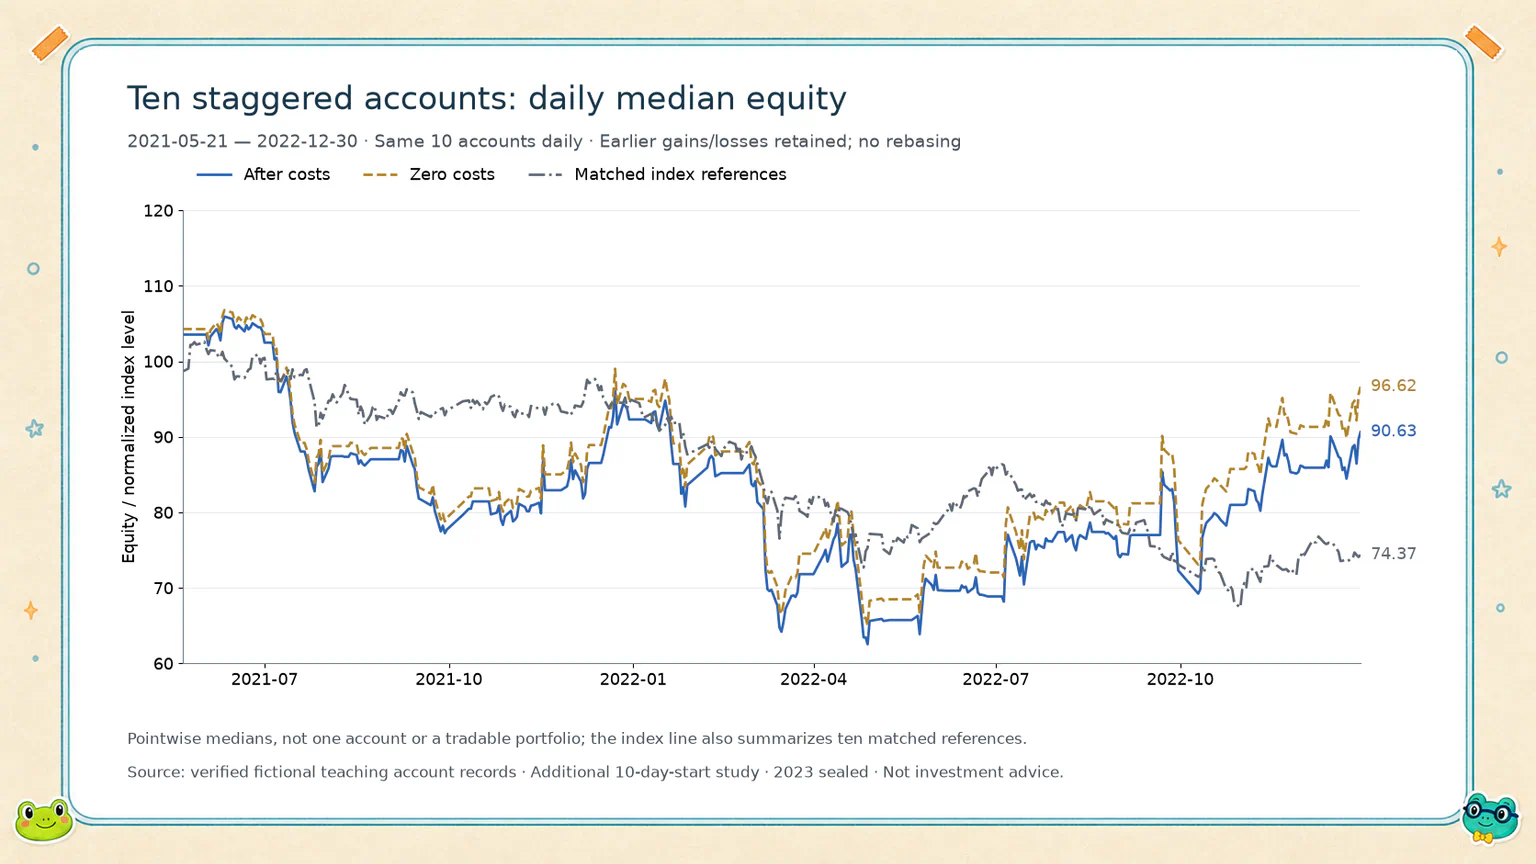
The chart starts on May 21, 2021, when the last account becomes active. From that date, we can compare the same ten accounts every day. Earlier accounts retain the gains or losses they already made; nothing is reset to 100 on that date. The index line also summarizes each account's matched reference.
Alongside the curve, keep every account's result. Don't retain only the median.
| Account | Start date (2021) | Account return | Its same-period index return |
|---|---|---|---|
| A01 (primary) | Jan 4 | −5.21% | −25.73% |
| A02 | Jan 18 | −5.21% | −28.81% |
| A03 | Feb 1 | −5.21% | −27.73% |
| A04 | Feb 22 | −7.22% | −33.08% |
| A05 | Mar 8 | −7.22% | −26.95% |
| A06 | Mar 22 | −11.53% | −22.70% |
| A07 | Apr 6 | −14.05% | −25.24% |
| A08 | Apr 20 | −16.68% | −23.57% |
| A09 | May 7 | −17.06% | −23.69% |
| A10 | May 21 | −12.47% | −25.53% |
The median return across these ten accounts is −9.37%, the highest is −5.21%, and the lowest is −17.06%. All ten exceed their own same-period index references, but none makes a profit.
There are seven distinct complete trade paths. The duplicate paths remain in the results too. These counts describe this teaching experiment, not the probability of future profits or outperformance.
Save the results—and the questions
At this point, you should be able to open the equity curves, trade records and summary in your project. AI has done more than write a program: it has run it, checked it and reported any unresolved issues.
If the summary gives numbers without file locations, ask for the locations. If the chart text is too small, ask AI to enlarge it. You don't have to accept the first presentation it produces.
But don't let it casually switch industries, change the exit day or “find more profitable parameters.” Preserve this run as it is. The 2023 envelope stays closed.
Hoppy puts the new curve next to the earlier event-study table.
“Now I've got all the numbers. And a few more questions.”
We don't need to squeeze the answers into one sentence.
Next, we'll use the curves and trade records we just produced to find out what happened to those 100 units.
Lesson discussion
Share a question, insight, or different view—and see how other learners are thinking.