Lesson 5
Open the 2023 Envelope
Keep the research-period rules unchanged and use held-out 2023 data to see which account results repeat and which do not.
Hoppy finally understood the account records: beating the index and making money were two different things.
It was time to open the 2023 data they had set aside for this Nine-Beat Count study.
But once he found the files, he hesitated.
“Shouldn't we improve the rules a bit first? I'm not exactly eager to show anyone that curve.”
“Improve them until when?” asked Dr. Hop.
“Until I'm happy with the results, I suppose.”
“Then we might be working on the old data for quite a while.”
Hoppy looked at the screen. Trying filters and different ways to sell had meant looking at results and making choices along the way.
That was part of the research. But they still hadn't answered another question: How would their chosen setup perform outside the data that helped them choose it?
This time, the rules were staying put.
New data, not a new answer to aim for
We used 2021–2022 to find opportunities, try conditions, and see how the account worked. Now we take the same approach into 2023. We don't switch industries or change the exit day in response to the new results.
That's why we set some data aside. It didn't help us choose these trading rules. Now it can show us whether the patterns we saw during research appear in another period.
This is called holdout validation.
One detail matters here: our earlier data checks used the availability of dates in 2023 to identify gaps. So this isn't data we never touched in any way. What we didn't use to choose this Nine-Beat Count setup was its prices and returns.
“Does taking the old rules into 2023 mean buying the same stocks again?”
No. We're carrying over how to find opportunities, when to buy and sell, and how to use the money—not copying an old list of trades.
Whatever new opportunities appear in 2023 get handled by those rules. When there are none, the account can simply hold cash.
Before opening it, check the agreement with AI
Open your research project in Codex, or use WorkBuddy.
There's no need to reinstall the environment or find a new backtesting program. First, have AI read the rules and research notes already in your project.
You could say:
Ask your AI research assistant
I want to validate this project's already-selected trading setup on the 2023 holdout period. First, read the existing research handoff, trading rules, and account rules. Briefly restate our final choice; don't substitute an older candidate version. If files are missing or rules conflict, ask me first.
For this test, use 2023-01-03 through 2023-12-29. Each account starts fresh with 100 units of cash and no position. Do not carry over previous holdings or account gains and losses, but do continue each stock's historical counts and indicators. Start ten accounts at offsets of 0, 10, 20, …, 90 market trading days from the period's first market trading day. The earliest account remains the primary account. Don't change start dates based on results, and retain accounts that follow identical trading paths.
Keep the existing entry, exit, funding, fee, slippage, and end-of-period rules. Save a short validation agreement separately without overwriting earlier research. Do not read or calculate 2023 prices, signals, or returns yet. Wait for my confirmation before running it.
The main thing to check is: Did AI describe the setup you actually chose earlier?
Our reference setup still considers only the PY-10 “Mobility Networks” teaching industry, within the companies that passed the original data checks. After a downward Nine-Beat Count completes, enter at the next valid daily bar's open. Count the entry bar as bar 1 and exit at bar 10's close. Each account starts with 100 units, keeps its money together, and holds only one company at a time. Fees and slippage stay unchanged too.
If you kept your own filter, have AI continue with that version. Don't quietly swap it for the course's choice just to make comparisons easier.
Giving each account a fresh 100 units lets us examine 2023 separately. It isn't a cash top-up disguised as recovery from the previous account's losses. We save the two periods separately.
And you don't have to count the bars across New Year's Day yourself. Let AI continue from the existing history. A new calendar year doesn't reset the count.
Ready? Let it run
Once you've confirmed the agreement, it's time to open the envelope.
We still want two sets of results: one that measures each opportunity separately, and another that follows what a limited amount of money could actually buy and sell. We just learned to distinguish those two views. Now we take both into the new period.
Try it
I confirm the validation agreement we just saved. Now actually run the 2023 holdout test under that agreement. Do not change the rules or select new parameters.
First result set: calculate opportunities that meet the agreed trading rules and whose entry dates fall within 2023, one by one. Use the existing event-return formula, without capital constraints or trading costs. Only events that complete their exit within 2023 belong in the return statistics. List unfinished events and signals with no next entry bar separately; don't assign them zero returns or extend into 2024. Signals confirmed in 2022 whose originally scheduled entry falls in 2023 may qualify. Do not buy later to make up for a missed entry.
Second result set: run the limited-capital accounts from the ten agreed start dates. Compare each with its own same-period CSI 300 reference. Also retain a zero-fee, zero-slippage version following the same trading path. Accounts must not look ahead to check whether an entire exit window will be available before deciding to enter. Value and retain unfinished positions at period end under the agreed rules.
Save event-level results, trade records, daily total equity, and a plain-language summary. Plot the primary account, plus daily medians over the same ten accounts beginning when the last account starts. Retain earlier gains and losses in the medians; do not rebase them. The index curve should also be the median of the accounts' individually matched references. Save new results separately without overwriting research-period files.
Check that signal confirmation precedes entry, historical counts weren't reset, capital wasn't double-used, and costs and valuations are correct. Cross-check key results using a different calculation method. Rerun the same program to check consistency. Tell me which files you actually saved, what you checked, and whether anything remains unresolved. Continue troubleshooting ordinary technical errors. Poor returns are not a program error: don't change the rules to improve them.
This isn't a request to sit back and wait for a “success report.”
When AI finishes, open the saved curves and summary. Check that the two result sets are separate and that the agreement was followed. If AI only describes what it expects to happen without running anything or saving files, ask it to carry out the task.
If your project previously prohibited reading 2023, explicitly authorize this confirmed validation scope while leaving the other research boundaries intact. You don't need to delete every restriction.
Let's see what our course experiment found. You can also finish your own run before reading on.
First result: individual opportunities look less promising
Leave the account aside for a moment. We'll first examine each opportunity that meets our reference rules.
We're returning to the research-period set of 151 events with complete ten-bar holding windows. The earlier exit-rule comparison required twenty bars for every event, leaving 150. The two tables use different sample requirements.
| Measure | 2021–2022 research period | 2023 validation period |
|---|---|---|
| Complete 10-bar events | 151 | 59 |
| Mean return | 2.71% | −0.42% |
| Median return | 1.93% | −0.11% |
| Share of events with positive returns | 62.25% | 44.07% |
Hoppy had been hoping to spot some impressive numbers. Instead, he spotted two minus signs.
During research, both the mean and median event returns were positive. In 2023, both fell slightly below zero, and fewer than half the events made money.
The positive-return pattern we saw during research didn't repeat this time.
We didn't pick those 59 events afterward to make the result look better. There were 67 candidates: 59 completed ten bars within the year, 7 hadn't reached ten bars by year-end, and 1 had no next bar available for entry. The last two categories remain separate rather than being recorded as zero-return events.
“So Nine-Beat Count doesn't work at all?” asked Hoppy.
We can't jump to that conclusion. This test examines the chosen industry filter together with a 10-bar exit. We didn't rerun the random-date comparison, nor compare this setup with a version that has no industry filter.
We can say that this setup's positive event-return pattern didn't repeat. We can't turn that into “this signal is useless in every situation.”
Getting the current result right matters more than declaring a winner or loser.
Second result: the account lost money, but still beat the index
Now open the primary account curve.
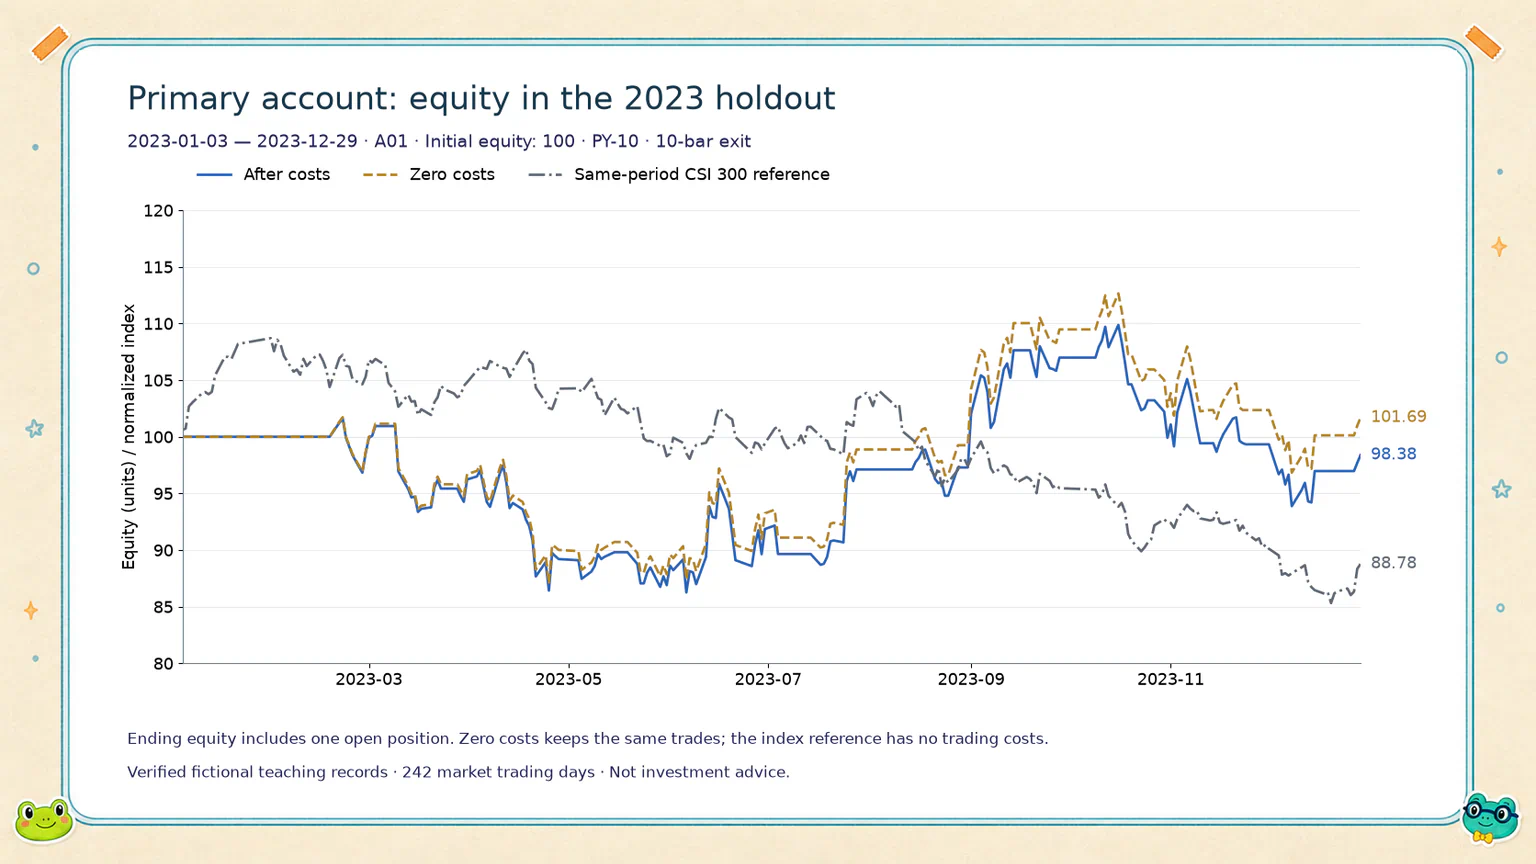
| Measure | Primary account in 2023 |
|---|---|
| What the initial 100 units became | 98.38 units |
| Net account return | −1.62% |
| Same-period CSI 300 return | −11.22% |
| Difference versus the index | 9.61 percentage points |
| Maximum drawdown | 15.12% |
“I know how to read this now,” said Hoppy. “We lost money, but the index fell more.”
Exactly. Not every part of the result reversed.
Mean event returns turned negative, while the primary account still outperformed its same-period index reference. Those statements don't conflict. One summarizes individual opportunities. The other follows limited capital and compares it with a market reference over the same period.
The primary account entered 17 trades. It completed 16 exits and still held one position at year-end. It didn't buy all 59 complete events, and its ending 98.38 units weren't entirely cash from closed trades.
Without fees and slippage, the same trading path ended at 101.69 units. With them, it ended at 98.38. The cost effects we saw in the previous lesson still matter here.
Also, don't call the strategy “improved” just because the earlier loss was 5.21% and this one was 1.62%. The rules didn't improve; the periods changed. One spans two years and the other one year. Their cumulative returns alone can't rank the setup's quality.
Did the other nine accounts have different experiences?
Yes. Some even made money this time.
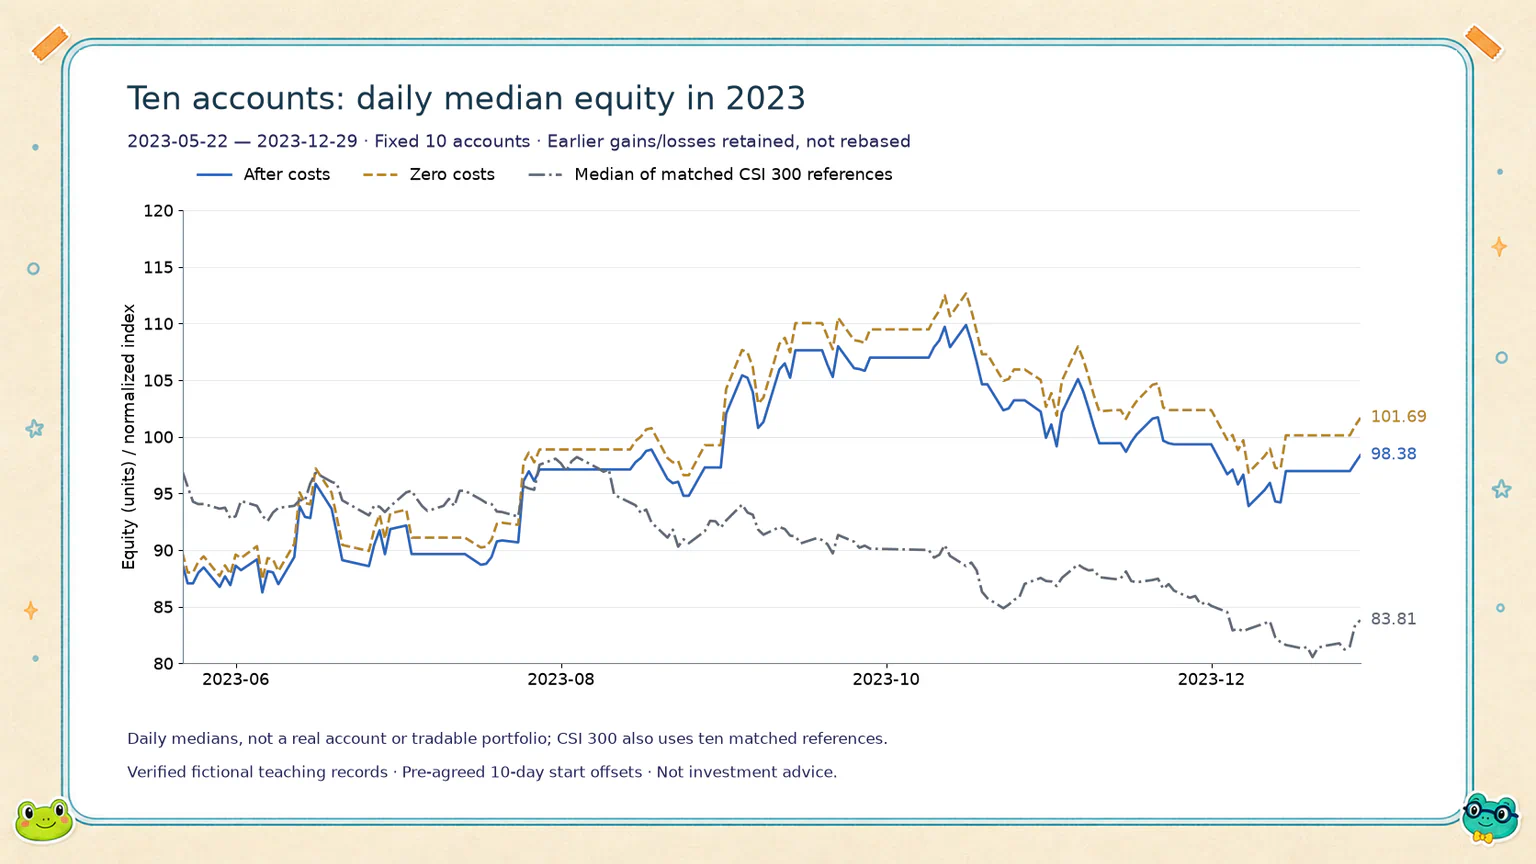
Across the ten fixed start dates:
- 4 accounts made money, and all 10 beat their own same-period index references.
- The median return was −1.62%.
- The highest return was 21.93%; the lowest was −5.20%.
- There were 7 distinct full trading paths. Duplicate paths were retained.
Hoppy immediately spotted the 21.93%.
“That one's good! Why don't we start on that date from now on?”
The problem is that we already know what happened after that date.
We fixed all ten start dates before opening the data, and we had already named the primary account. Promoting the best performer afterward would mean choosing by the answer again.
Later-starting accounts also skipped part of the period, and different paths can share many trades. These aren't ten independent validation tests.
The median chart helps us look beyond the best account, but it isn't an actual account either. We still need to retain all ten original results: the duplicates, the losses, and the particularly tempting one.
So what do we call this result?
We don't have to force it into a “pass” or “fail” box.
For our course experiment, we could write:
In the fictional 2023 teaching data, the selected setup's mean and median event returns turned negative. The positive-return pattern from the research period didn't repeat. The primary account still lost money, but beat the same-period CSI 300. The ten fixed starts produced both gains and losses; the best account cannot stand in for the whole setup.
It isn't the tidy story we may have imagined: “find a pattern, then keep making money.” But it is what the experiment produced.
If your results differ, don't ask AI to change the numbers to match ours. First ask whether it used the same data and the same trading and account rules. Did it mix up event returns with account returns?
If you chose your own filter, a different conclusion is perfectly possible. If the same rules produce substantially different results, ask AI to inspect the actual records. Don't ask it to “fix the return to this number.”
Finally, have AI add what you observed—and what remains unclear—to your validation summary. Keep the original research-period summary. There's no need to erase earlier conclusions and pretend you knew the ending all along.
Can we change anything after seeing this?
Of course you can have new ideas.
But once you've seen the 2023 results, a version revised in response to them is no longer the setup that was chosen without those returns.
That doesn't mean research must stop. It means “I got it right after seeing the answer” isn't the same as “I got it right without seeing the answer.”
Hoppy kept the two minus signs. He didn't rename the 21.93% account “primary,” either.
He saved the results.
We've come a long way from “Can counting to 9 help me buy the bottom?” We now have rules, experiments, accounts, and feedback from a period that didn't help us choose the trading setup.
It is still an experiment using fictional teaching data and simplified assumptions—not advice for real-world investing.
In the final lesson, we'll look back at the whole process. Beyond a few curves that go up and down, what have we actually learned?
Lesson discussion
Share a question, insight, or different view—and see how other learners are thinking.