Lesson 5
Which Nine-Beat Events Are Worth Entering?
Compare a small set of entry filters on one scale, then freeze any result that passes the prior standard for the next stage.
At the end of the previous lesson, 1.35% stopped looking like a final answer. It became the number before our next question:
If completed falling Nine-Beat Counts do not all behave alike, can we add a condition and find a subset with better historical results?
Hoppy opens the experiment again. There are still 1,908 eligible events on the table, and their 10-bar outcomes are all over the place.
“Can we find a group that is more promising to study?”
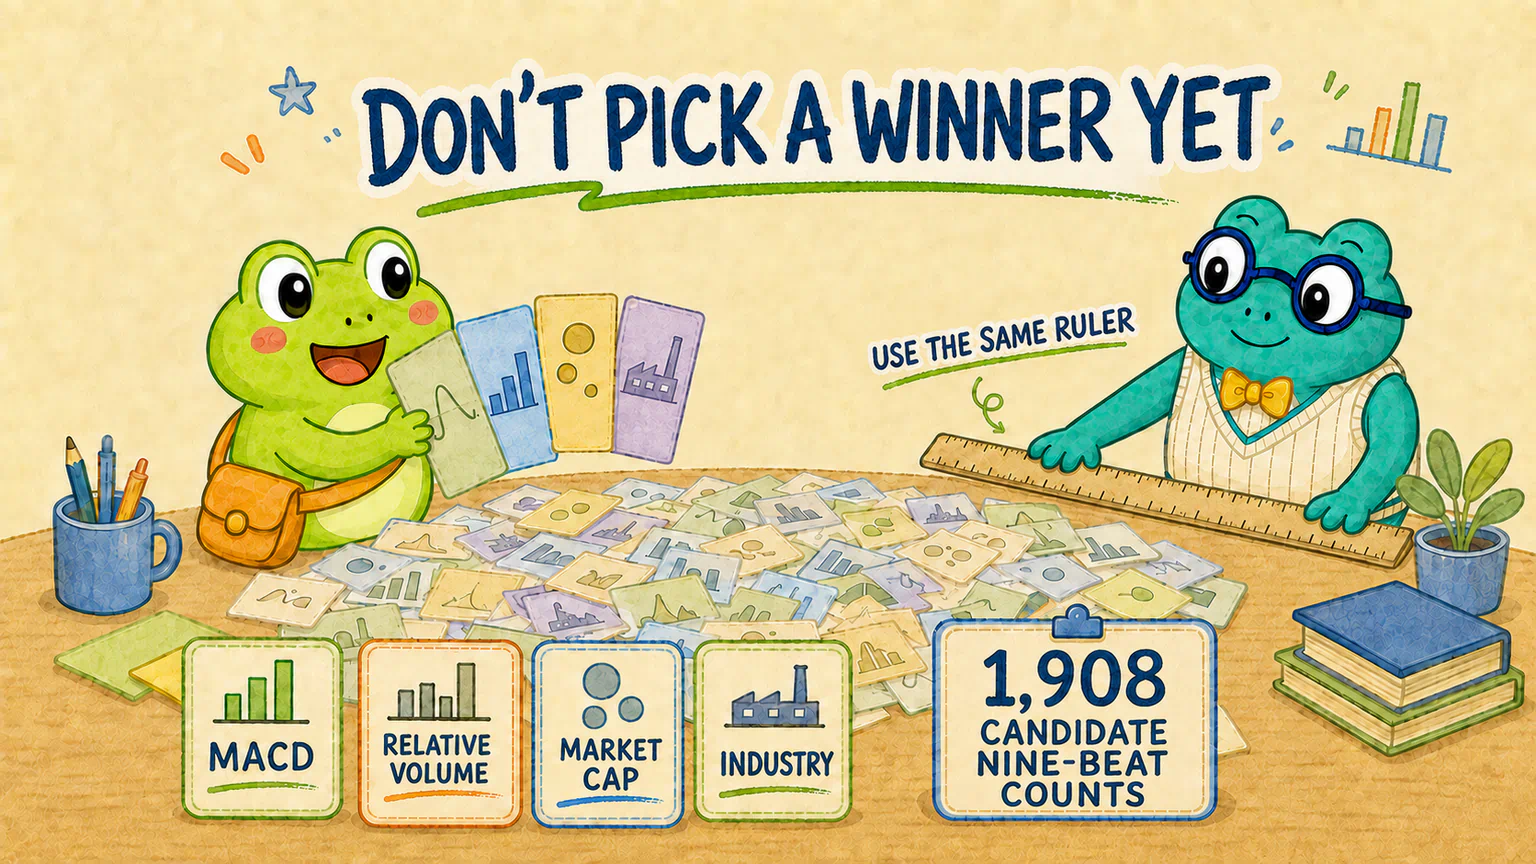
He writes four ideas on separate slips of paper:
MACD
Volume
Market cap
Industry
“Let’s try all four and keep whichever one has the highest return.”
Dr. Hop looks over.
“We can try them. But this is a filter experiment, not a historical-return beauty contest.”
You already use filters every day
Open a food-delivery app and you may see hundreds of nearby restaurants.
You probably do not inspect every menu from top to bottom. You add a few conditions first:
- open now;
- delivery in roughly half an hour;
- not wildly expensive;
- noodles today, not burgers.
After one round of filtering, hundreds of choices may become a dozen.
That does not guarantee every remaining restaurant will taste good. A filter only narrows the candidate list according to rules you chose.
The nine-beat experiment works the same way.
We began with all 1,908 eligible completed falling Nine-Beat Counts. Once we add a condition, some events stay and some are skipped. Then we ask whether the retained group behaved differently in the study data.
All eligible completed falling Nine-Beat Counts
→ Add one condition
→ Keep a subset
→ Compare it with the original events
That condition is what this lesson calls an entry filter.
It is not a crystal ball, and it does not guarantee a profit.
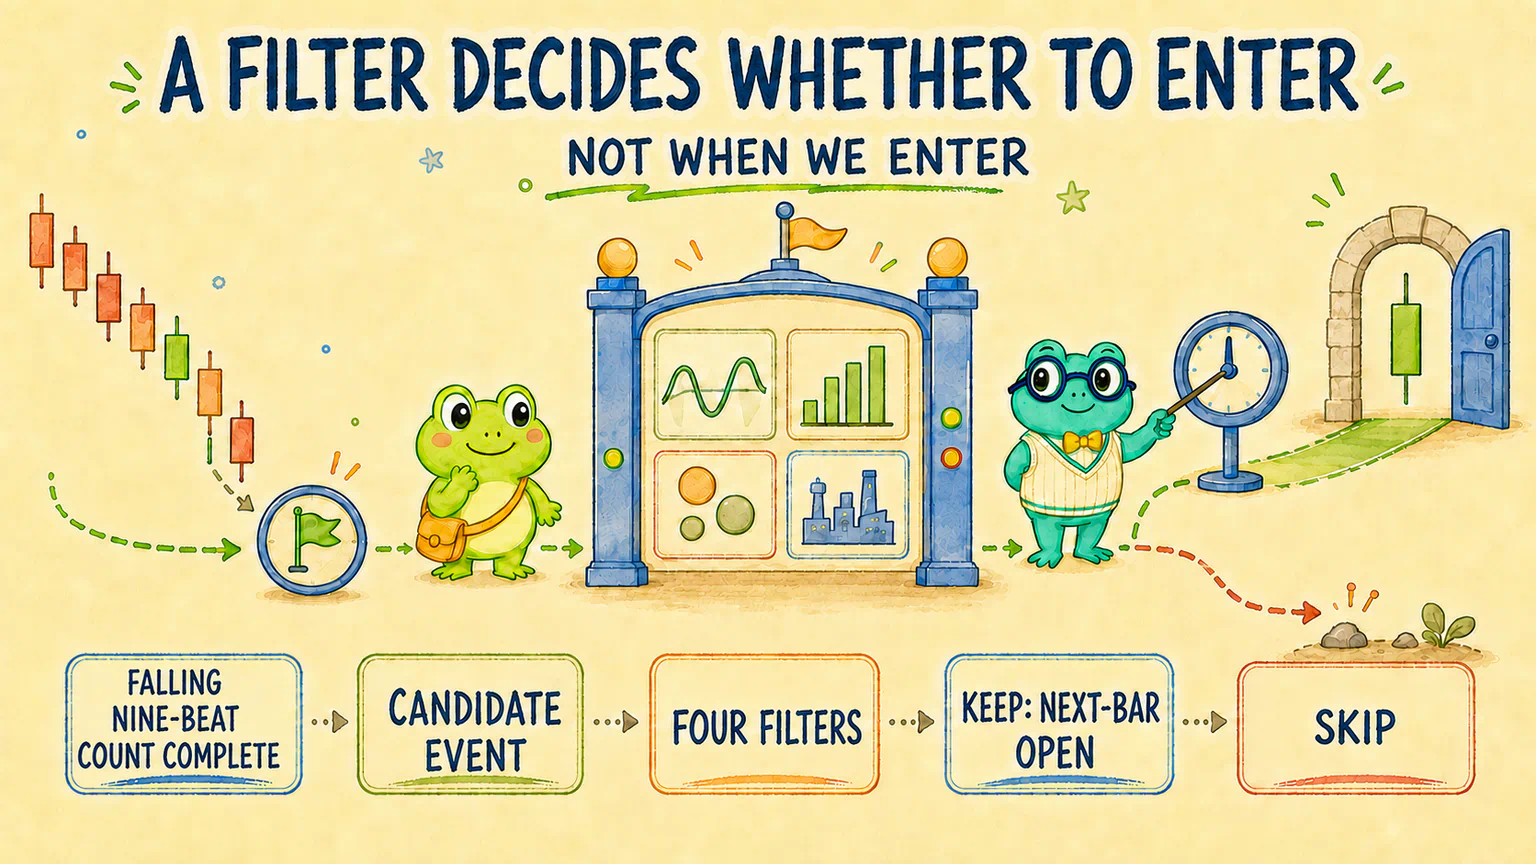
It answers only one question: should this candidate event stay on the entry list, or should we skip it?
The event, the entry time, and the filter are different things
These ideas are easy to mix together, so let us separate them.
| What is it? | What does it answer? |
|---|---|
| Completed falling Nine-Beat Count | When did a candidate event appear? |
| Fixed entry time | If we keep it, when do we enter? |
| Entry filter | Do we keep this candidate or skip it? |
We are not searching for a later, prettier entry date in this lesson.
The 9 is still confirmed only after that bar closes. If the event passes the filter, entry still occurs at the next valid bar’s open.
The filter changes whether we enter, not when we enter.
Meet the four filters
We will begin with four ideas that are fairly easy to explain.
| Filter | What is it asking? | How does the course version look? |
|---|---|---|
| MACD | Was price momentum beginning to improve when the count completed? | Compare that day’s MACD histogram with the previous valid bar |
| Relative volume | Was trading more active than usual for this stock? | Compare that day’s volume with the prior 20 valid bars |
| Market cap | Did events behave differently across company-size groups? | Split that day’s relative market cap into small, medium, and large groups |
| Industry | Did events behave differently across industries? | Use the 11 fixed teaching industries in the dataset |
None of these directions has only one possible definition.
For MACD, we might look at a changing histogram, the zero line, a crossover, or another state. Volume might be compared with the prior 5, 20, or more bars. Market cap could use fixed currency thresholds or relative daily ranks.
There is no official answer sheet declaring one split uniquely correct. Different definitions ask slightly different questions.
We will not explore every variation here. The point is to agree with the AI on one clear, testable version and then see what it produces.
Put the same ruler on the table first
The filter may change. For now, these parts do not:
Candidate event: a completed falling Nine-Beat Count
Original baseline: enter every eligible completed falling Nine-Beat Count
Entry time: next valid bar’s open after the 9 is confirmed
Temporary exit: 10th valid bar’s close, counting the entry bar as bar 1
Study data: 2021–2022
Holdout data: keep 2023 sealed
Why are we still using the fixed 10-bar exit?
Because we want to compare entry filters. If we change the filter and the exit timing together, we will not know which change produced a different result.
The 10-bar exit is one common measuring ruler for this experiment. It is not our final exit rule.
You do not have to copy the course exactly
This is a good moment to open the lab and have a real conversation with the AI.
You may continue in the existing conversation. If it has become unwieldy, start a fresh Codex conversation in the same lab folder. If Codex is unavailable to you, WorkBuddy is still an option.
A fresh conversation does not know what we just researched. Ask it to inspect the existing files instead of pretending it remembers the story.
You can begin with this:
Open exploration | Discuss before calculating
I have already completed a falling Nine-Beat Count event study in this project. First inspect the existing data, programs, and research summaries. In plain language, report the frozen nine-beat definition, eligible company list, study dates, entry timing, temporary 10-bar exit, eligible 10-bar event count, and baseline results.
I now want to study entry filters. The candidate directions are MACD, relative volume, market cap, and industry. Do not calculate returns yet, and do not read, calculate, or reveal 2023 price direction, nine-beat signals, or returns.
Explain several reasonable ways to define each filter and what question each definition would answer. Do not automatically sweep through many parameters or search for the combination with the highest historical return. If I am unsure, recommend one simple set of definitions suitable for a first experiment.
Before calculating anything, confirm with me which groups we will use, the minimum number of events each group should retain, which results we will examine, and how we will avoid keeping only the prettiest number. Save the agreed version as a short experiment agreement and wait for my approval before running it.
The AI’s suggested definitions may not match the course definitions.
You can ask follow-up questions such as:
- Why compare volume with the prior 20 bars?
- If we use 10 bars instead, are we asking a different question?
- What exactly counts as MACD “improving”?
- Why might market cap be ranked separately on each trading day?
- If a group contains only a few dozen events, how much should we trust it?
These questions do not require everyone to arrive at one answer.
Once you and the AI have agreed on a version worth trying, freeze that agreement and run it:
Open exploration | Run the agreed version
Run the entry-filter experiment exactly as specified in the agreement we just confirmed and saved. Keep the nine-beat definition, eligible company list, entry time, temporary 10-bar exit, and study dates unchanged. Keep 2023 sealed.
Compare one filter at a time and retain every group named in advance. For each group, report at least the event count, company count, number of completion dates, mean return, median return, positive-return share, and return distribution. Call out any clear concentration on a small number of dates.
Do not show only the best-looking group. Do not move a boundary because a result disappointed us, and do not continue searching new parameters or combinations automatically. Save the complete attempt history, clear charts, and a plain-English summary. Finally, tell me which results may deserve further study, which did not improve, and what the current evidence still cannot support.
Open exploration does not mean searching until something wins
Hoppy quickly discovers one very tempting instruction:
“Keep optimizing until you find the highest-return parameters.”
It sounds diligent. In practice, it may tell the AI to keep opening drawers in the historical data until it happens to find a pretty answer.
We can ask new questions and revise a later experiment. But each revision should leave a trail: what the previous version tried, why we changed it, and what the new version changed.
Do not let the AI erase every earlier answer sheet and keep only the highest score.
That is why open exploration still has three guardrails:
- do not open 2023;
- do not change the nine-beat rule, entry time, and temporary exit at the same time;
- do not rename “our current candidate” as “the optimum.”

The course ran one reference experiment too
After open exploration, we still need a shared course route.
Otherwise, everyone would carry a different entry rule into the next stage, and the course counts, charts, and conclusions would no longer be directly comparable.
Before looking at filter returns, the course fixed one simple reference version:
- MACD uses standard
12 / 26 / 9parameters and asks only whether the histogram on the9bar improved from the prior valid bar; - relative volume divides current volume by the average of the prior 20 valid bars, then uses
< 0.8,0.8–1.2, and≥ 1.2groups; - market cap ranks all eligible companies on the
9date and divides them into small, medium, and large thirds; - industry uses the 11 fixed PY_L1 teaching industries in the dataset.
The course also fixed a conservative gate before seeing the results.
A candidate cannot be a tiny handful of events or look good only in its mean. We also inspect its median, positive-return share, mean after removing a small fraction of extreme outcomes, and whether too many events crowd into a few dates.
These definitions are not uniquely correct, and they do not exhaust every parameter we could try.
They are simply one limited experiment chosen in advance so the course can continue along a common route.
Every company, industry, and price series in this course experiment is fictional teaching data. The results can teach us a research process; they cannot evaluate a real industry or guide a real trade.
What did the four filters produce?
The original baseline is still 1,908 eligible completed falling Nine-Beat Counts:
| Events | Mean return | Median return | Positive-return share | 1% trimmed mean |
|---|---|---|---|---|
| 1,908 | 1.35% | 0.50% | 53.14% | 1.16% |
Once we add filters, the results do not all point in one tidy direction.
| Course reference group | Events | Mean return | Median return | Positive-return share | Course decision |
|---|---|---|---|---|---|
| MACD improving | 873 | 0.85% | 0.00% | 49.83% | Did not improve |
| Relative volume near normal | 456 | 2.47% | 1.27% | 59.65% | Attractive numbers, but date concentration exceeded the preset limit |
| High relative volume | 217 | 2.05% | 1.52% | 55.30% | Attractive numbers, but date concentration exceeded the preset limit |
| Small market cap | 607 | 2.24% | 1.37% | 58.48% | Attractive numbers, but date concentration narrowly exceeded the preset limit |
| PY-04 Urban Networks | 195 | 2.82% | 1.26% | 55.38% | Passed the course gate |
| PY-10 Mobility Networks | 151 | 2.71% | 1.93% | 62.25% | Passed the course gate |
This table includes only the groups most useful for understanding the conclusion. The complete experiment retained the other volume and market-cap groups plus all 11 industries. It did not delete the disappointing results.
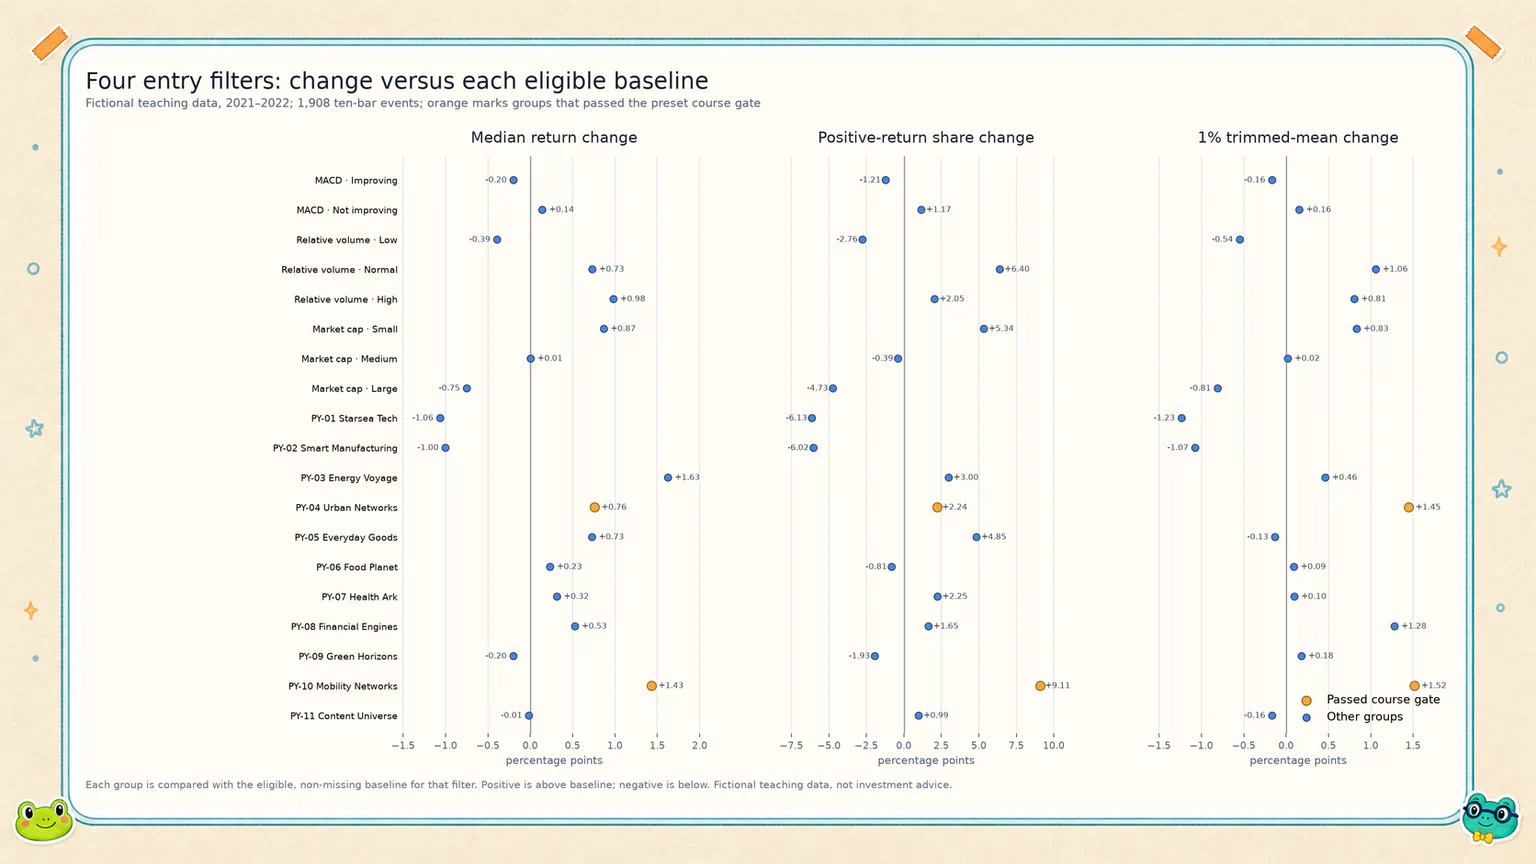
A small amount of filter data was missing. The formal course decision therefore compares each group with the eligible baseline that has data for that specific filter, not only with the all-event baseline above.
Why can prettier numbers still fail the gate?
The near-normal relative-volume group, high relative-volume group, and small-cap group all beat their own baselines in mean, median, and positive-return share.
If this were a “highest return wins” contest, they would all be on the podium.
But the rainstorm from the previous lesson has not disappeared.
When a group is too concentrated on a few market dates, its events may simply have shared one unusually favorable stretch. The course fixed an acceptable concentration limit before looking at the results.
These groups crossed that line, so they did not become course candidates.
That does not prove they are useless. Nor does it turn this concentration threshold into a universal law. It only means we cannot see an attractive number and then move a prewritten gate out of its way.
Why did the highest mean not win?
Two groups passed the course gate:
| Candidate | Events | Mean return | Median return | Positive-return share | 1% trimmed mean |
|---|---|---|---|---|---|
| PY-04 Urban Networks | 195 | 2.82% | 1.26% | 55.38% | 2.61% |
| PY-10 Mobility Networks | 151 | 2.71% | 1.93% | 62.25% | 2.68% |
PY-04 had the higher mean.
If we looked only at that column, it would win.
But before the experiment, the course had already decided how to rank multiple passing candidates: compare median improvement first, then positive-return-share improvement and sample coverage. A few very strong events do not get to choose the winner alone.
PY-10 had the higher median and positive-return share, as well as a slightly higher 1% trimmed mean. The course reference route therefore selected PY-10 Mobility Networks.
This is not “the best answer across every possible definition.”
A more accurate sentence is:
In this fictional teaching dataset, under this nine-beat definition, these filter groups, and the selection rules fixed in advance, PY-10 is the candidate the course will carry into the next stage.
The course now reaches a fork
You do not need to delete your own experiment because the course selected PY-10.
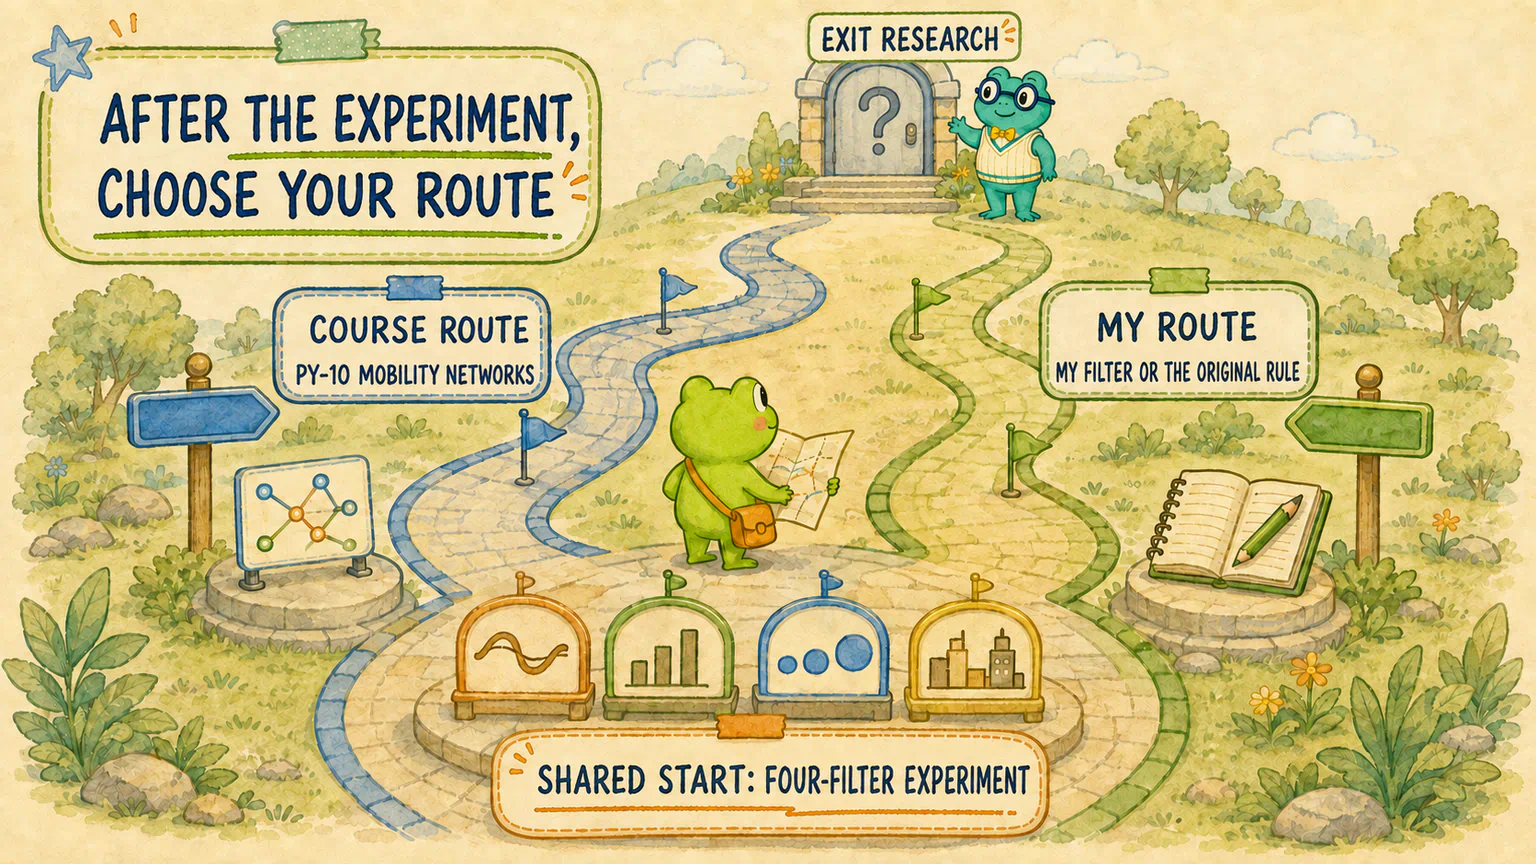
Two routes are both reasonable from here.
Follow the course reference route
Use PY-10 as the entry filter.
Your later event counts, exit experiments, charts, and results will be easier to compare with the course. This is the lower-friction route for your first complete walk through the research process.
Keep your own route
Use the filter you froze with the AI, or keep the original rule that enters every eligible completed falling Nine-Beat Count.
You can still research exits and run an account-level backtest. Your sample size, return figures, and eventual conclusion may differ from the course. That is a natural consequence of different rules, not an error.
What you should not do is switch back and forth—use your filter in one step, fill a gap with a course number in the next, and end up unable to say which rule the project actually runs.
Freeze the entry rule in a handoff card
If you choose the course reference route, the frozen entry rule is:
- Universe: the 292 fictional companies that passed the data health check;
- Candidate event: a completed falling Nine-Beat Count under the already confirmed rule;
- Entry filter: the company belongs to the PY-10 “Mobility Networks” teaching industry;
- Signal confirmation: after the
9bar closes; - Actual entry: the next valid bar’s open;
- Current evidence: the 2021–2022 study data;
- Not handled yet: final exit rule, limited capital, fees, slippage, market benchmark, or 2023 holdout validation.
Notice that the fixed 10-bar exit is not part of the final entry rule.
It completed its job as a comparison ruler. It has not earned the right to impersonate a final exit.
Whichever route you choose, tell your local AI and have it save the decision in a handoff. Reading about PY-10 on this page does not automatically update your project.
Give the AI this task:
Freeze my entry rule
Stop searching for new filters and parameters. First ask me to confirm whether I want the course reference route or my own route. The course reference keeps only events whose company has industry_id equal to PY-10 (Mobility Networks), from the already frozen eligible companies and completed falling Nine-Beat Count events. Confirm the signal after the 9 bar closes and enter at the next valid bar’s open. Do not choose a route for me.
After I confirm, use the actual project data and experiment records to save the chosen rule and relevant file locations in a self-contained research handoff. If my chosen version differs from the experiment just run, preserve that experiment and calculate only the chosen version’s results needed for the handoff. Do not search other alternatives or copy course numbers.
State which filter I selected, or whether I kept the original unfiltered rule; its exact definition; the retained event count; the main historical results; why I did not select the other attempts; and the remaining risks. Also state the nine-beat definition, company universe, study dates, signal-confirmation time, and actual entry time.
Label the 10-bar exit only as the temporary ruler used in this comparison, not as a final exit rule. Keep 2023 sealed. Do not call the current candidate an optimum, and do not omit failed or abandoned attempts. After saving, give me the handoff file’s location and briefly restate which events we enter, when we enter, and what remains unresolved.
A proper handoff should not depend on the AI remembering this conversation.
Give it to a brand-new conversation, and that assistant should still be able to explain which nine-beat counts we plan to enter, when we enter them, and which questions remain unresolved.
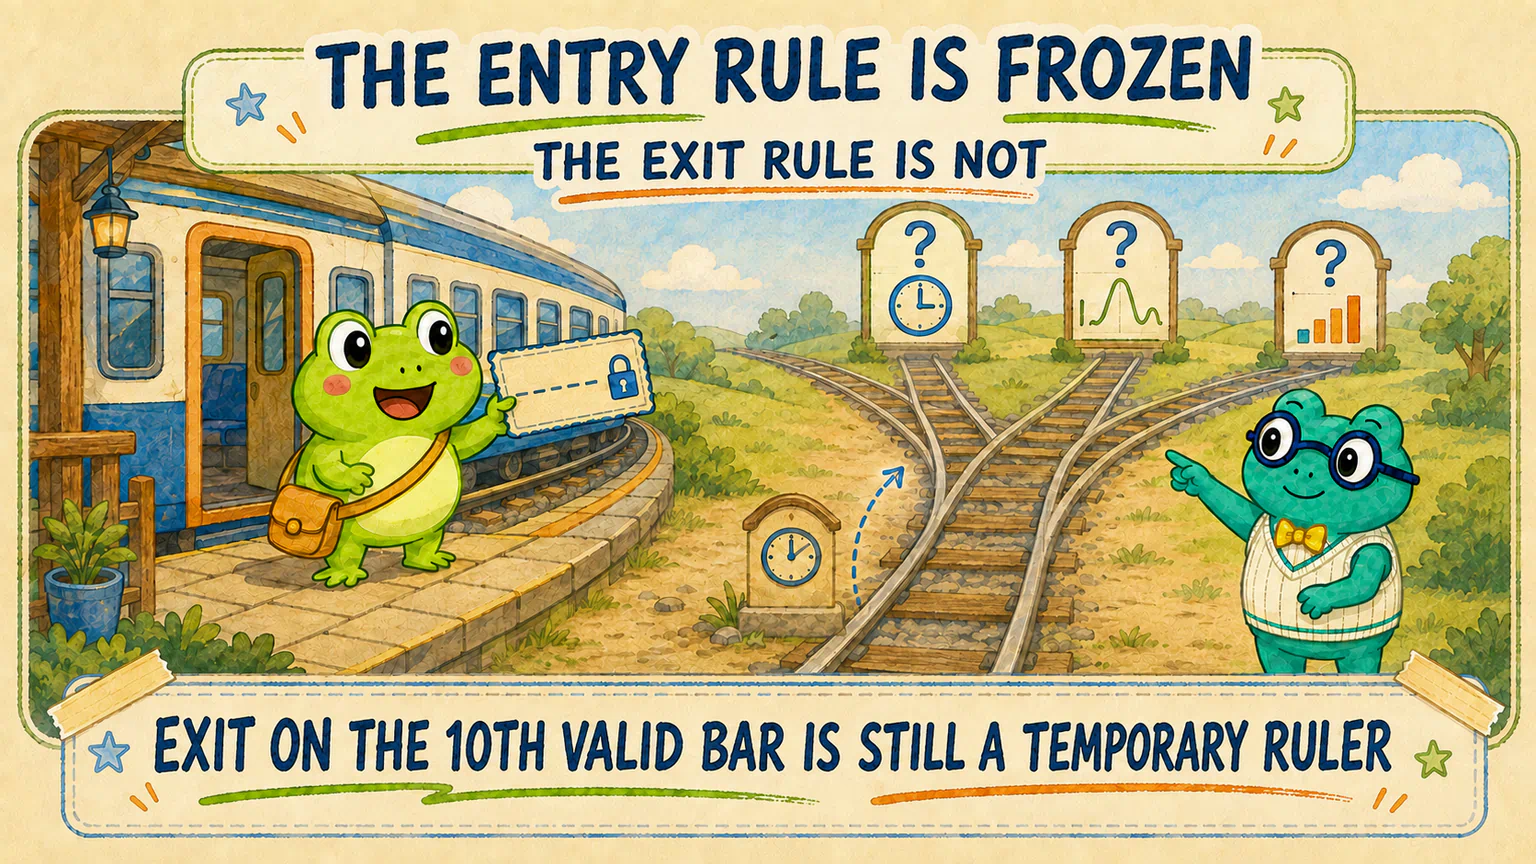
We have an entry rule. When do we exit?
Hoppy saves the course reference entry card.
“Easy now. If a PY-10 company completes a falling Nine-Beat Count, I enter at the next bar’s open and sell on day ten.”
“The first half is the candidate entry rule we just froze,” Dr. Hop says.
“And the second half?”
“Still a temporary ruler.”
We have now answered two questions:
Which nine-beat counts do we consider entering?
When do we enter?
But we have not genuinely compared ways to decide when to exit.
Could a fixed duration, MACD, volume, or another condition known at the time help us define a more suitable exit rule?
That is the question waiting in the next stage.
What did we actually finish?
We did not exhaust every filter, and we did not build a strategy ready for real trading.
We completed this path:
Understand what an entry filter does
→ Explore definitions with the AI
→ Keep every attempt
→ Read the course reference experiment
→ Choose the course route or your own route
→ Freeze one explicit entry rule
The AI can calculate many groups quickly.
But we still have to decide which questions to try, when to stop, and which rule to carry forward.
A filter can identify a subset of nine-beat events worth studying further, but a current candidate is not an exhaustively proven optimum. Once the rule is frozen, move on to the exit question instead of quietly rewriting the answer.
Reference tool: read this if your results differ
Below are the complete reference rules and an audit prompt. You have finished the main lesson. Use this section if you want to check your implementation against the course version; it is not a required step before moving on.
First ask which route you took.
If you and the AI chose a different MACD definition, volume window, market-cap split, or candidate gate, different results are normal. You ran your own experiment; you do not need to edit its numbers into the course answer.
If you used the same teaching data and every course reference definition, however, the baseline event count and group results should reconcile. A large mismatch suggests that one research convention changed somewhere.
You do not need to copy the tables above into the chat. The following task contains the reference rules and diagnostic checkpoints and can be given directly to the AI:
Give this directly to the AI | Audit the course reference rules
I want to audit whether the falling Nine-Beat Count entry-filter experiment in this project faithfully implemented the reference rules below. First inspect the actual data, existing nine-beat events, program, and research outputs. Do not edit code or results merely to match a checkpoint, and do not read, calculate, or reveal 2023 price direction, nine-beat signals, filter results, or returns.
Verify the experiment baseline first. The universe is the 292 fictional companies that passed the data health check. The study period is 2021-01-04 through 2022-12-30. Base events are confirmed completed falling Nine-Beat Counts. The signal is confirmed after the 9 bar closes. Entry uses the next valid bar’s forward-adjusted open. Count the entry bar as bar 1 and use the 10th valid bar’s forward-adjusted close as the temporary exit. There should be 1,908 events with a complete 10-bar window. Keep 2023-01-03 through 2023-12-29 sealed.
Every filter must use only information known by the close of the 9 bar or earlier, and the four filters must be run separately:
- MACD histogram improvement: Use each stock’s forward-adjusted close and pandas recursive calculations for standard
12 / 26 / 9MACD.EMA12 = ewm(span=12, adjust=False, min_periods=12),EMA26 = ewm(span=26, adjust=False, min_periods=26),DIF = EMA12 - EMA26,DEA = DIF.ewm(span=9, adjust=False, min_periods=9), andMACD histogram = DIF - DEA. If the histogram on the9bar is strictly greater than the previous valid bar’s histogram, classify it as “improving.” Otherwise classify it as “not improving.” If the two values cannot be compared, classify it separately as “insufficient data.” Do not add a zero-line or crossover condition. - Relative volume: Calculate
trading_volume_shares on the 9 bar ÷ mean trading_volume_shares over the prior 20 valid bars. The prior 20 bars exclude the current bar.< 0.8is “low,”0.8 ≤ value < 1.2is “near normal,” and≥ 1.2is “high.” Classify insufficient history, missing volume, or a non-positive historical mean separately as “insufficient data.” - Same-day relative market cap: Use
total_market_cap_cnyon the9date. For each trading date, rank non-missing market caps from smallest to largest across the fixed 292-company eligible universe, using average ranks for ties. The bottom third is “small,” the middle third is “medium,” and the top third is “large.” Classify missing values separately. Do not rank only the companies that happen to complete a nine-beat count that day. - Teaching industry: Use the fixed
industry_idand PY_L1 teaching industries incompanies.parquet. Report all 11 industries. Do not merge, split, or hide industries after seeing their returns.
For each filter, first create an eligible baseline containing events with valid data for that filter, then compare its groups with that baseline. Report each group’s event count, company count, number of distinct completion dates, maximum events on one date and that share, mean return, median return, positive-return share, 1% trimmed mean, and 5th–95th percentile range. Do not report only the best group.
A candidate must satisfy all of the following: at least 100 events, 10 companies, and 50 distinct completion dates; mean return at least 0.20 percentage points above its filter’s eligible baseline; a higher median; positive-return share at least 1 percentage point higher; a higher 1% trimmed mean; and maximum one-day event share no more than 2 percentage points worse than the eligible baseline. If multiple groups pass, rank them first by median improvement, then positive-return-share improvement, and finally date, company, and event coverage. Do not choose solely by mean return. Do not add combination filters in this audit.
The following course checkpoints are for locating the earliest difference, not answers to copy. The original 10-bar sample should contain 1,908 events. MACD should have 1,779 comparable events and 129 insufficient-data events, split into 873 improving and 906 not improving. Relative volume should have 1,893 comparable and 15 insufficient-data events, split into 1,220 low, 456 near normal, and 217 high. The three market-cap groups should contain 607, 671, and 630 events, with no missing market cap. Industry counts from PY-01 through PY-11 should be 251, 278, 114, 195, 219, 107, 139, 73, 248, 151, and 133. Under the reference rules, PY-04 “Urban Networks” and PY-10 “Mobility Networks” should pass the gate, with PY-10 ranked first by the selection order above.
First compare the program’s actual conventions with these rules line by line, then recompute the key checkpoints from the frozen events. Produce an audit table with the columns “stage, reference rule, actual result, match, possible impact,” and identify the earliest stage that differs. In plain language, explain whether the mismatch comes from the data version, event list, field, calculation time, group boundary, or candidate decision.
If the local project intentionally uses a different custom rule set, preserve its results and list the differences clearly. Do not pretend the two experiments are directly comparable. If you confirm a program error, explain the smallest proposed fix and its likely impact, then wait for my approval before editing or rerunning anything.
Lesson discussion
Share a question, insight, or different view—and see how other learners are thinking.