Lesson 1
How Far Does a Quant Study Need to Go?
Start with the time-dependent Nine-Beat Count and map the route from an idea through event research, rules, and held-out review.
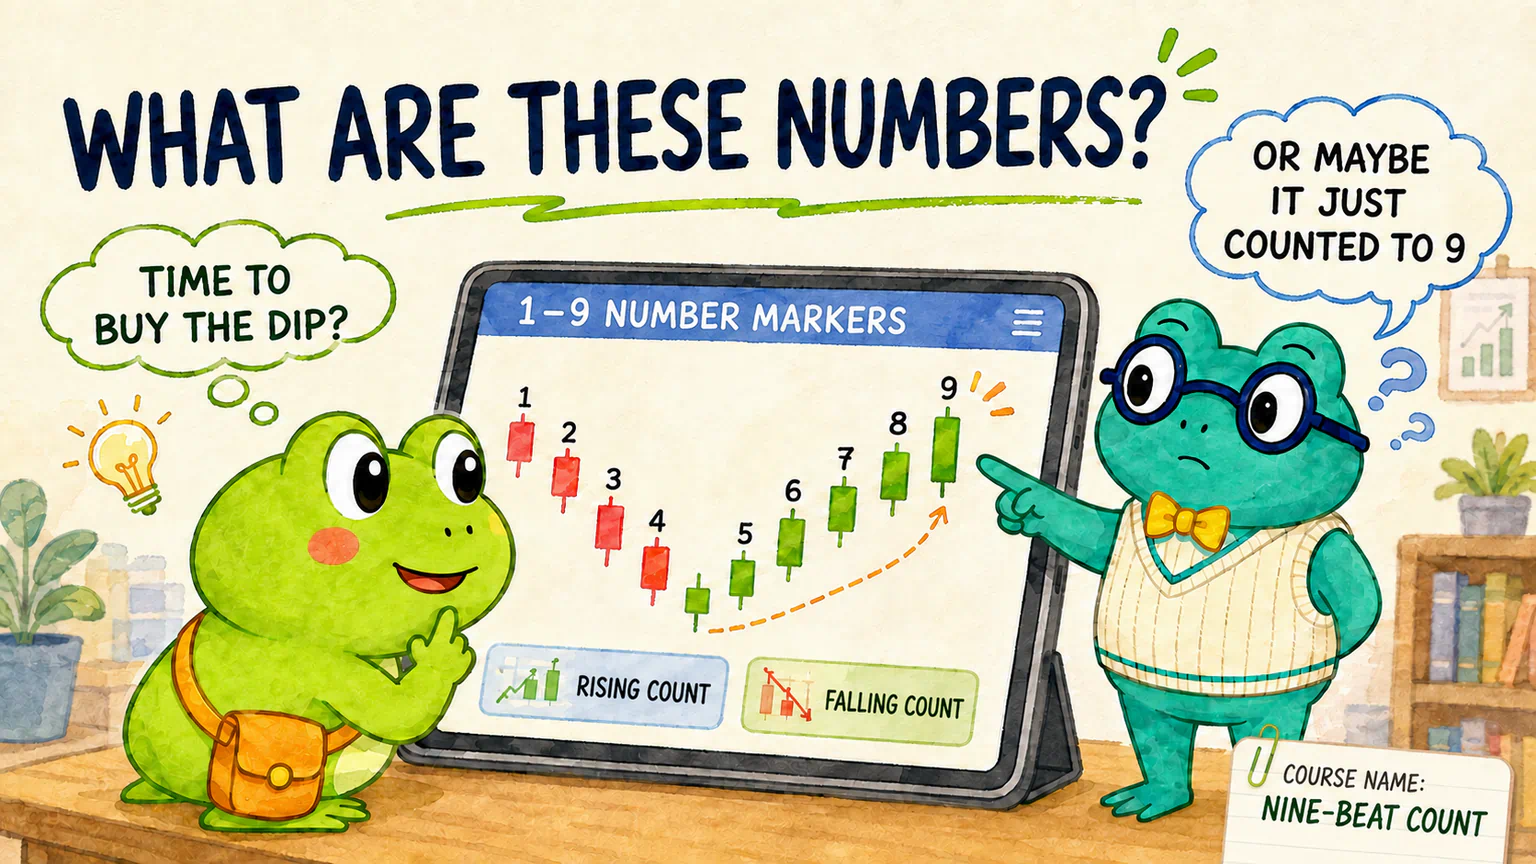
One day, Hoppy is browsing candlestick charts in a Chinese stock-market app.
Prices rise and fall as usual. But scattered above and below a few candles is a string of numbers:
1, 2, 3, 4 ... 8, 9
“Who is doing math on the chart?”
Hoppy opens the explanation and learns only that it is a technical count from 1 to 9. Different apps may not count it in exactly the same way.
So that our own study does not talk past itself, we give the fixed teaching rule we are about to define a name: the Nine-Beat Count. It has rising and falling versions, but both count forward from 1 to 9. A falling count does not count backward.
Hoppy stares at the falling Nine-Beat Count and suddenly has a bold idea:
If a stock has completed a falling Nine-Beat Count, perhaps it has already fallen far enough.
What if buying after every completed falling Nine-Beat Count makes a profit more likely?
His reasoning is simple.
Buy the dip.
Hoppy tells Dr. Hop about his idea.
“How do you know that is the bottom?” asks Dr. Hop.
“It counted all the way from 1 to 9. How much lower could it need to go?”
“It may have reached the bottom,” says Dr. Hop. “Or it may have simply reached the number 9.”
Hoppy looks at the chart again.
“So we need to test it?”
“Of course,” says Dr. Hop. “But this time, we will not stop after asking whether it had a small historical advantage. We will ask whether this idea can gradually become a clear set of trading rules.”
Our previous quant loop was not wasted
In the last study, we split fictional companies into two groups: IDs containing 8 and IDs without 8.
We wrote down the idea and rules, asked AI to read the data, compared the results, examined the distribution, challenged the apparent difference, and finally opened a period of data we had set aside in advance.
That was a genuine small loop of quantitative research.
It helped us answer this question:
Did one static feature coincide with different results in this historical dataset?
The nine-beat study goes a step further.
A stock ID does not contain 8 today and lose it tomorrow. A nine-beat pattern changes as each new candle arrives, and the same stock may produce the pattern more than once.
More importantly, we no longer want to know only whether a historical difference existed. We want to see whether that difference can gradually become a set of rules that we can execute and backtest.
The question has changed, so the research journey must grow longer too.
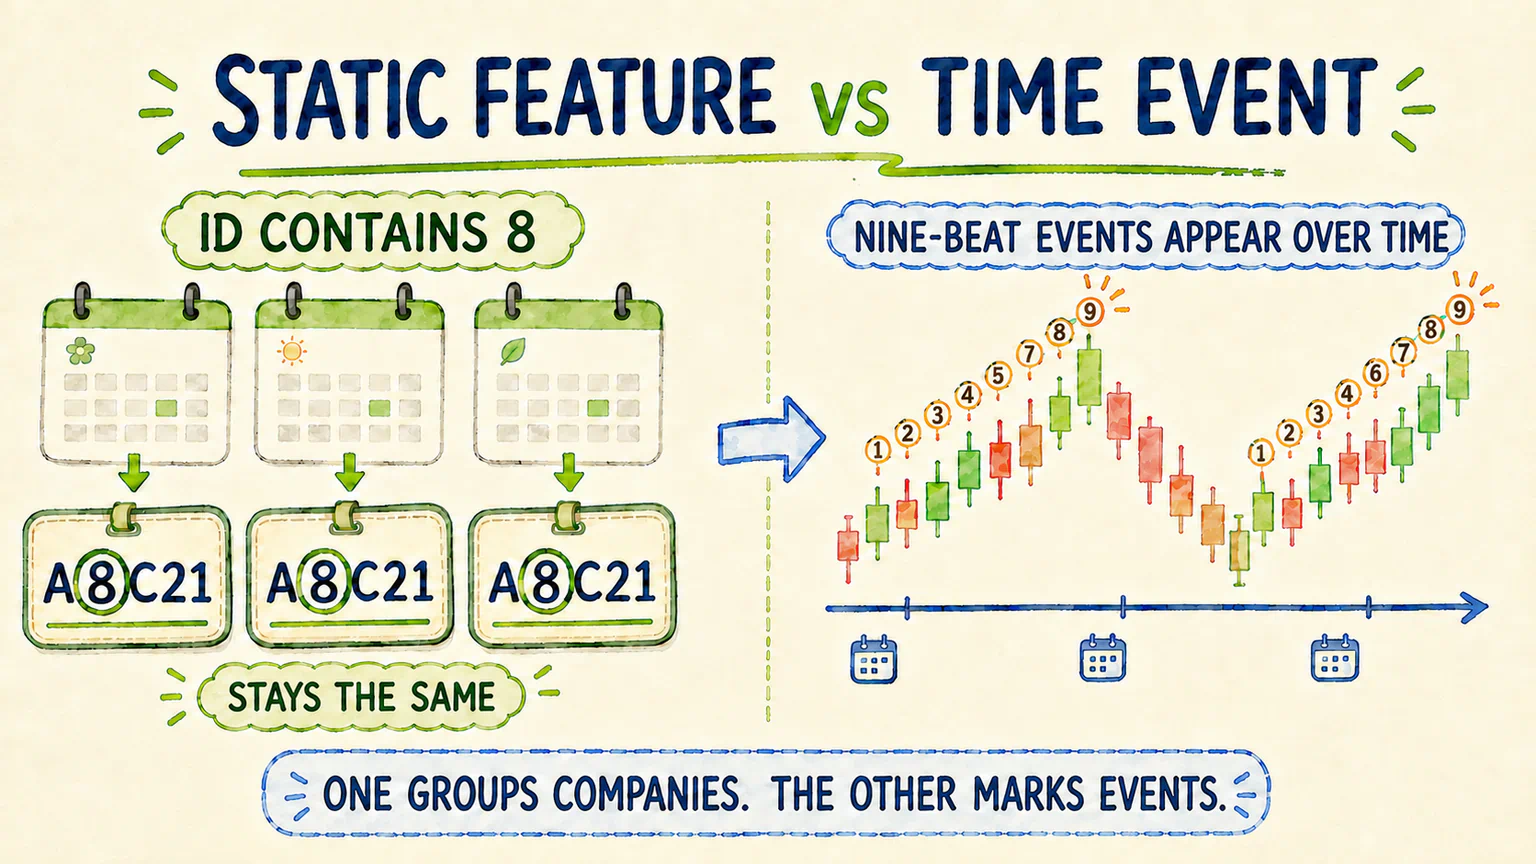
A minimal quant loop is not a useless half-finished project. It can help us reject a weak idea early. We need the rest of the journey only when we want to turn a tentative pattern into an executable strategy.
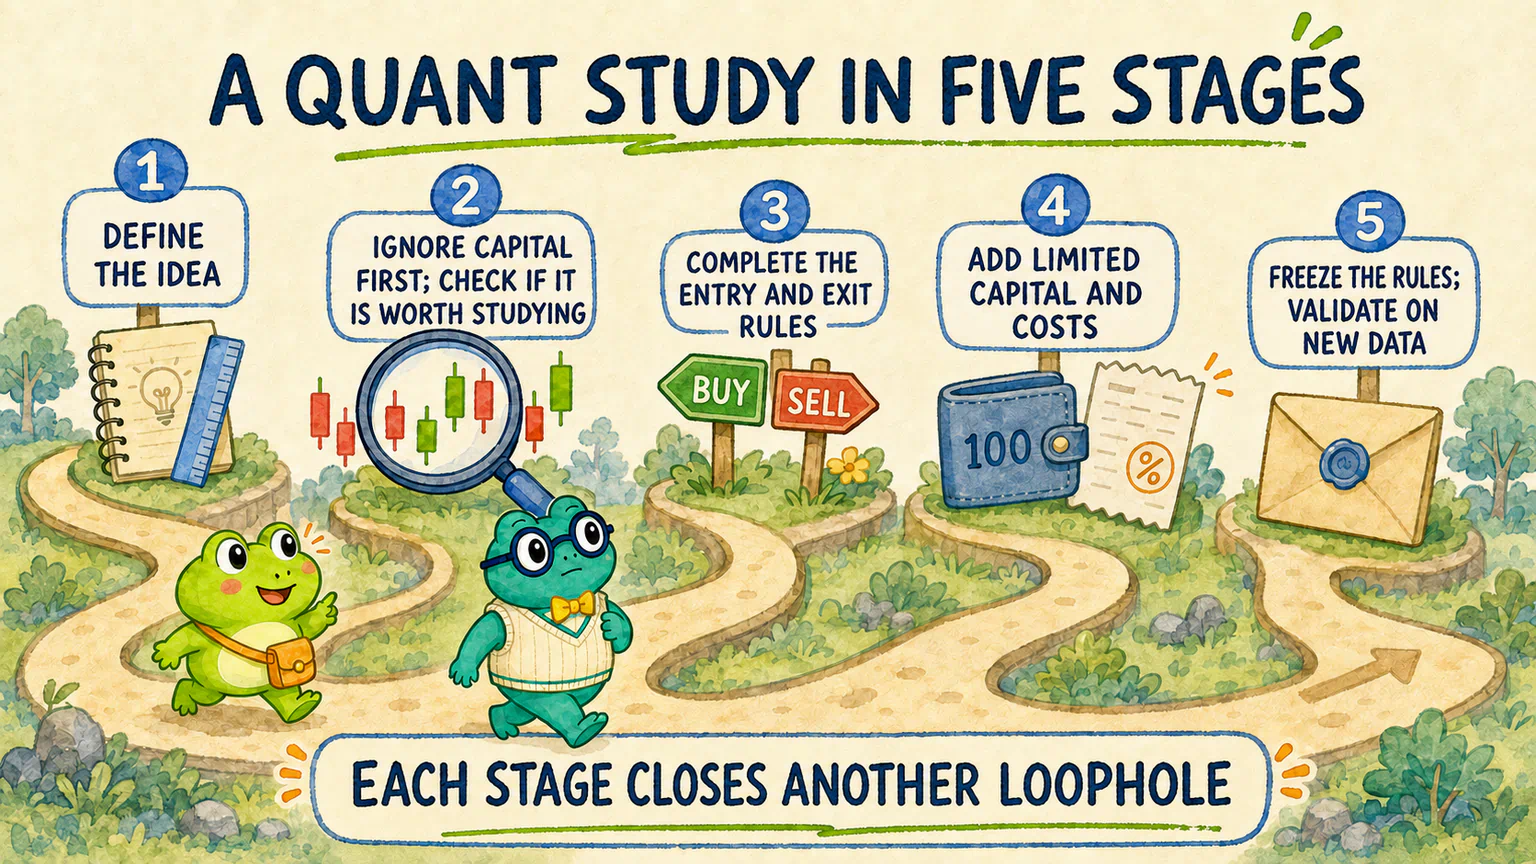
This time, we will travel through five stages
Dr. Hop does not dump every question on the table in front of Hoppy.
He arranges them into five stages.
Stage one: define the idea
“A stock is more likely to rebound after completing a falling Nine-Beat Count” already sounds like a hypothesis.
But every part of that sentence still needs another question.
What exactly is a falling Nine-Beat Count? What completes it? “More likely” than what? How long will we wait for a “rebound”?
If we do not fix these rules before seeing the results, two people may use the same name for two entirely different patterns.
So our first job is not to make AI calculate faster. It is to turn the idea into explicit rules.
Stage two: pretend we have fresh money every time
Once the rules are fixed, we will examine every completed nine-beat event in the historical data.
At this stage, we temporarily ignore how much money we actually have and how many signals appear on the same day. We treat each event as if it received its own independent pot of virtual money, then observe what happened afterward.
That is not a realistic trading account.
We do it to isolate a more basic question:
After a nine-beat event, did the stock behave differently from the same stock after ordinary, randomly selected dates?
If we find nothing unusual here, there is little reason to pile more rules on top.
If the data does show a weak pattern worth checking, the idea has earned only a ticket to the next stage. It has not become a strategy.
Stage three: decide which events to buy and when to sell
Suppose the basic idea is worth continuing. We still cannot announce that our “nine-beat strategy” is complete.
We need to answer two kinds of questions.
First: should we buy after every completed count?
We will keep the entry time fixed and test whether information already available at that moment—such as MACD, relative trading volume, market capitalization, or industry—can help us keep the more promising events.
Second: after buying, when do we sell?
Holding for a fixed number of days, waiting for an indicator to change, or forcing an exit when that condition never arrives must all be written as explicit rules.
Only then will we have a complete set of entry and exit rules that can move into an account-level backtest.
Stage four: add limited capital and trading costs
Until now, each nine-beat event has behaved as if a new pile of money appeared just for it.
Place every trade on one timeline, and the situation changes.
If we have only 100 units of capital, earlier trades may still be open when dozens of new signals arrive. We cannot buy them all.
Capital becomes occupied, opportunities are missed, every trade incurs fees, and the actual execution price may be worse than the ideal price in our rules.
We will therefore place the frozen entry and exit rules inside one historical account with limited capital. Then we can see how many signals it could actually take, how the account changed, and how the result compared with the CSI 300 over the same period.
This is the stage where our trading rules become an account-level backtest.
Stage five: freeze the rules and validate them on new data
After the research-period backtest, we will not keep changing parameters whenever the result looks disappointing and then retake the test on the same data.
We will lock the nine-beat, entry, exit, capital, and cost rules first. Only then will we open a period of data that played no part in choosing them.
The validation may bring good news. It may also overturn every encouraging result we saw earlier.
Neither outcome means the course has broken.
If the result reverses on new data, the validation still did its job: it showed us that the rules could not yet survive a fresh test.
Every new question closes another loophole
Hoppy looks over the route again.
“So after we define the nine-beat rules, we still cannot celebrate?”
“You may celebrate briefly,” says Dr. Hop. “Then ask whether the event is more unusual than random dates.”
“And if it beats the random dates?”
“Ask which events are worth buying and how to sell afterward.”
“And when we have entry and exit rules?”
“Add limited capital and trading costs.”
“And if the historical account works?”
“Freeze the rules and open new data.”
Hoppy falls silent for a moment.
“Every time we answer one question, another is waiting outside the door.”
That is exactly what this study is meant to show us.
New questions do not necessarily mean the earlier research was wrong.
Often, they mean we have discovered and closed another loophole that could have fooled us.
A quant study does not end when a program prints a return. It turns an idea into rules, develops a weak pattern into an entry-and-exit plan, then brings capital, costs, and new data back in for inspection.
AI can run quickly, but we still hold the map
The programs ahead will be more complex than the stock-ID grouping experiment.
We will ask AI to read data, identify nine-beat events, sample random dates, calculate returns, compare filters, run a historical account, and produce charts.
You do not need to learn how to write all of that code by hand first.
But AI's ability to write the program does not mean it should decide:
- Which question we are answering now;
- Which rules must be locked before we see the results;
- Where one experiment should pause;
- What the evidence supports—and what it does not.
AI can do the work quickly.
We still need to decide where the research is going.
First, make sure we are counting the same nine
The five-stage route is now on the table.
We do not need to make the historical account run today.
Hoppy looks back at the number 9 on the candlestick chart.
“So the first step is not asking AI to put a number 9 on the chart?”
“Of course not,” says Dr. Hop. “The first step is making sure the nine-beat pattern in your head is the same one in mine.”
If two people use different rules, precise calculations will only help both of them go wrong with greater confidence.
Next, we will turn the 1-to-9 idea into Nine-Beat Count rules that AI can execute and we can inspect.
Define the idea, then ask whether it is worth studying. Complete the entry and exit rules, add limited capital and costs, and finally freeze the rules and validate them on new data.
Lesson discussion
Share a question, insight, or different view—and see how other learners are thinking.