Lesson 3
Does Price Rebound More Often After a Nine-Beat Count?
Identify eligible events and compare them with random dates across several windows after a Nine-Beat Count completes.
Hoppy copies the four rules from the previous lesson onto a sheet of paper and opens his AI assistant again.
“I understand roughly how the nine-beat count works now.”
His hands return to the keyboard.
“Can I finally ask whether it makes money?”
Dr. Hop places a more complete set of rules beside him.
“We can start the experiment. But before we calculate any returns, let’s check whether the AI counted the pattern correctly.”
“Do I need to review the code?”
“No. Let the AI inspect its own code. We will inspect the charts it produces.”
You do not need to implement the counting algorithm yourself or approve every item on a long checklist.
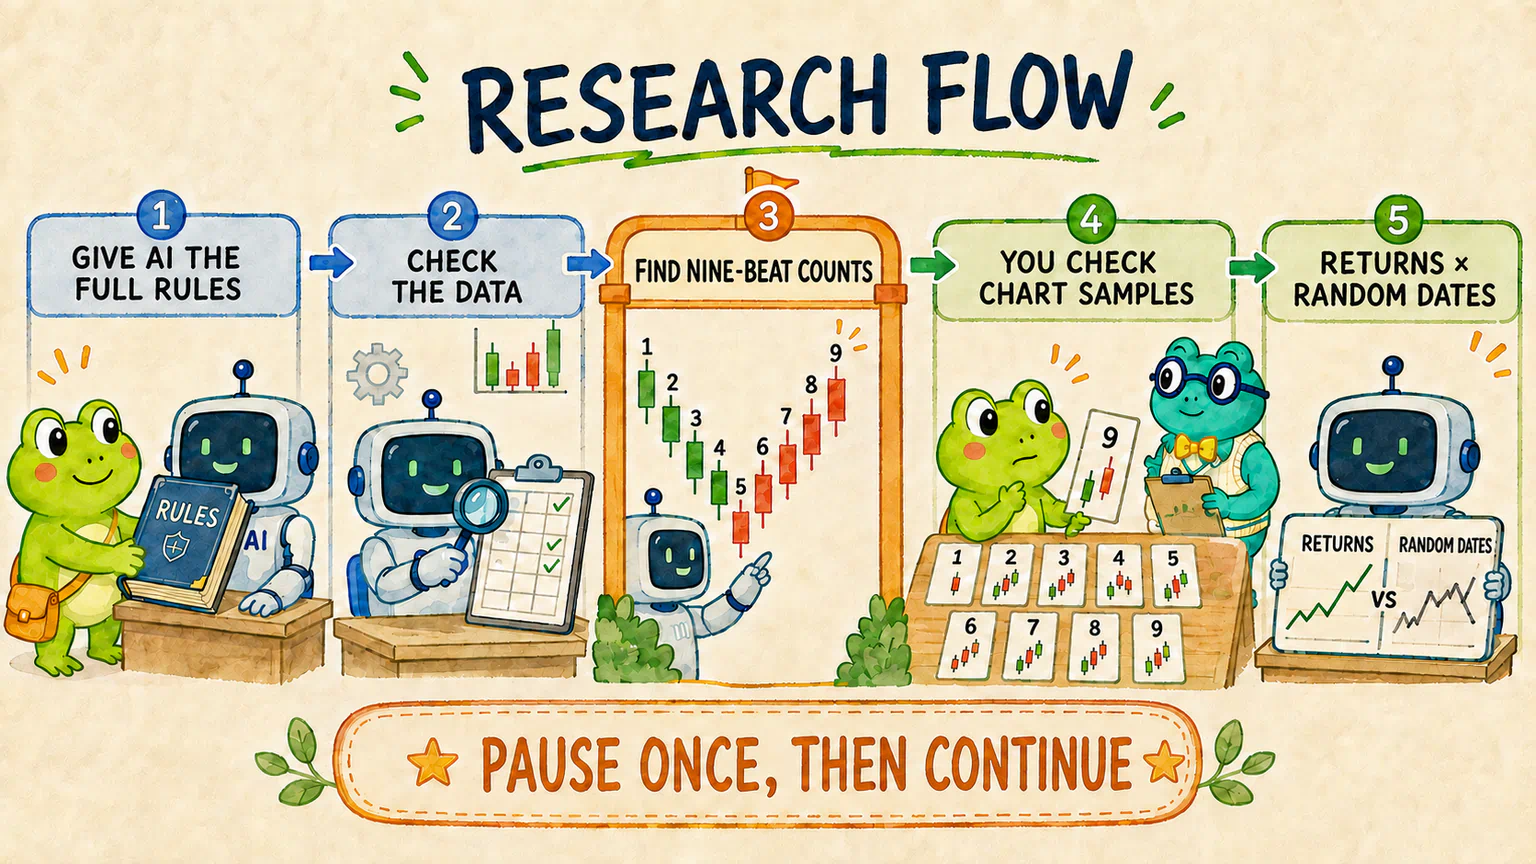
We will keep only one checkpoint in the middle:
Give AI the complete task
→ AI checks the data and finds nine-beat counts
→ We inspect a few chart samples
→ Confirm there is no obvious counting mistake
→ AI calculates returns and compares them with random dates
Why compare with random dates?
Before starting, Hoppy asks a question.
“If the average return after a nine-beat count is positive, does that mean it works?”
“Not so fast,” says Dr. Hop. “Prices may also rise after ordinary dates.”
Looking only at the nine-beat result is like asking for one student’s score without asking how difficult the exam was for everyone else.
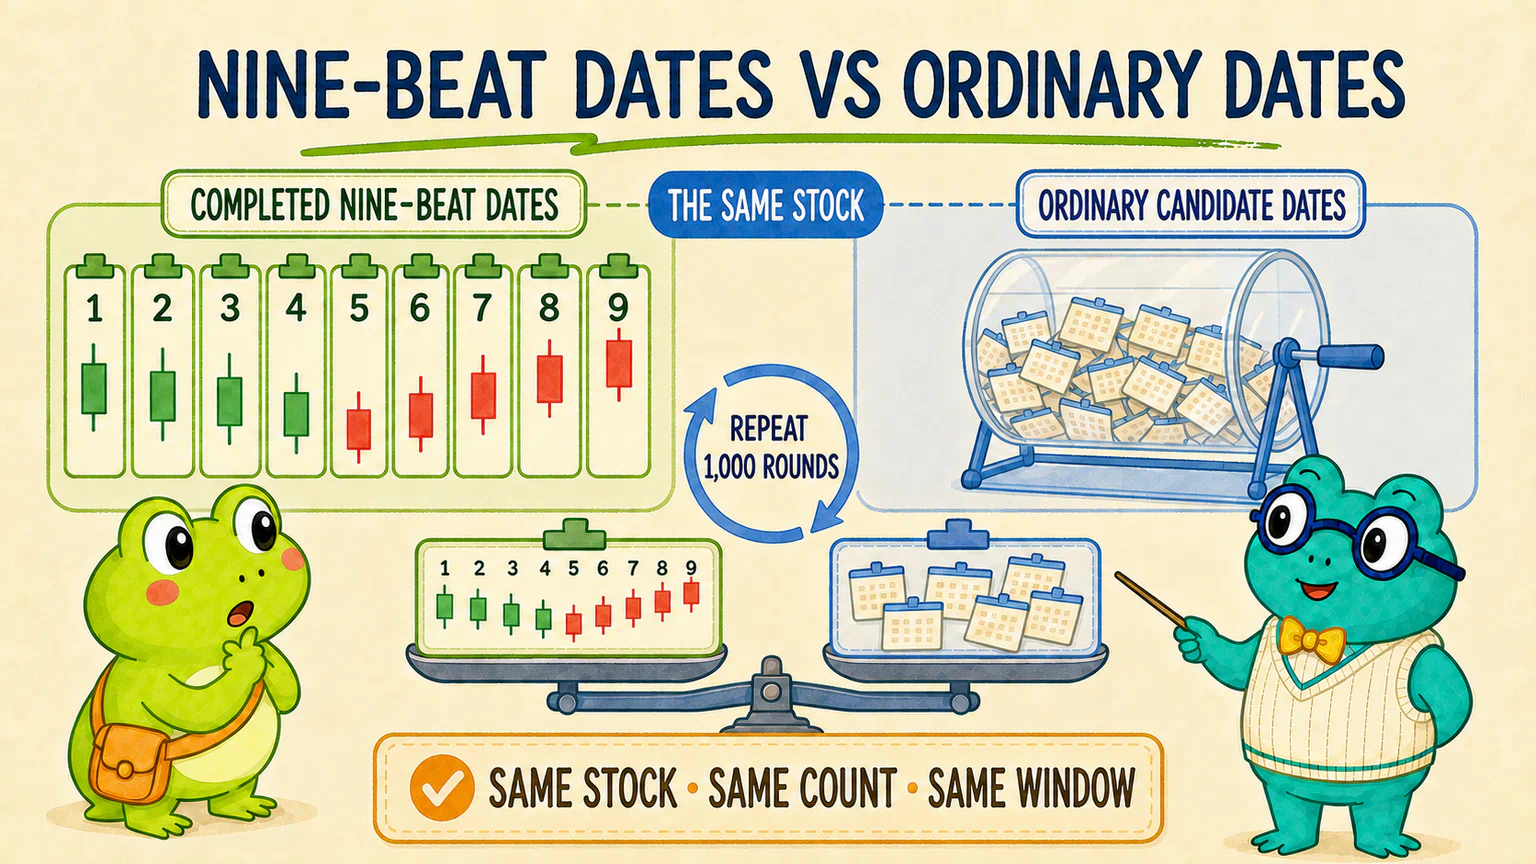
The random-date control asks:
If we had not seen a nine-beat count and had entered on other ordinary dates for the same stock, what result would we usually have obtained?
We repeat the draw for 1,000 rounds.
One draw can get unusually lucky or unusually unlucky.
Many draws help us see what “ordinary dates” usually look like.
We are not comparing with the CSI 300 yet.
Random dates answer, “Were nine-beat dates more unusual than ordinary dates for the same stock?” The CSI 300 will appear during the full strategy backtest, when the question becomes, “Did a limited-capital account outperform the market benchmark?” Those are different questions.
Start a fresh conversation and include the complete rulebook
Open a new Codex conversation in your lab folder.
If Codex is not available to you, WorkBuddy is also fine. The tool may change; the research task does not.
Why start fresh?
Because the AI does not automatically know which version of the nine-beat count we chose, and it should not piece together the rules from vague memories of earlier conversations.
The task brief below is long, but most of it is written for the AI.
You do not need to memorize every line or understand every implementation detail first. Give it to the AI, then let the AI install any missing analysis packages, write the program, run internal checks, and organize the outputs.
Give this to AI | Complete task brief
I want to use the Hoppy fictional teaching dataset in the current project to study this question: “After a completed falling Nine-Beat Count, is price more likely to rise than it is after an ordinary date?” Every company, identifier, and price in this dataset is fictional and exists only for learning. The result is not investment advice about any real security.
First inspect the current project structure. The teaching data will usually be in a folder named hoppy-teaching-dataset at the project root. It should contain README.md, data_dictionary.json, manifest.json, companies.parquet, stock_daily.parquet, and hs300_daily.parquet. Follow the actual files and fields you find. If a required Python analysis package is missing, install it with the project’s existing uv environment. Do not create a separate unrelated environment.
Use these fixed rules for the entire study:
- The main study uses only completed daily falling Nine-Beat Counts. The program may also identify completed rising Nine-Beat Counts to verify direction changes, but rising Nine-Beat Counts must not enter the return study.
- Sort each stock independently by
trade_date, and count only along that stock’s own sequence of valid candles. Use the forward-adjusted closing price inadjusted_closefor the comparison. - Let the current valid candle be
t.C[t] > C[t-4]meets the up condition,C[t] < C[t-4]meets the down condition, and exact equality has no direction. Do not count when fewer than four earlier valid candles exist. - When the same directional condition continues, count upward from 1. If an unfinished sequence meets the opposite direction, end the old sequence immediately and make that same candle number 1 of the opposite direction. If the two closes are equal, end the unfinished sequence and return to waiting.
- Reaching 9 completes one nine-beat count and locks that direction. Continued movement in the same direction must not display 10 or 11, and it must not immediately begin another sequence in the same direction. Equality unlocks the state and returns it to waiting. The opposite direction unlocks the state and makes that same candle number 1 of the new direction.
- If a stock has no daily candle on a market trading date, do not create a placeholder candle and do not interrupt the sequence merely because of that gap. When data resumes, continue along the stock’s own valid-candle sequence.
- Use the dates in
hs300_daily.parquetas the course market calendar. The data screen may check whether company-date records exist from 2021-01-04 through 2023-12-29, but it must not read or use 2023 price direction, nine-beat signals, or returns. If a stock has any single continuous gap strictly longer than 15 market trading days, exclude the entire stock before signal detection. A 15-day gap remains eligible; a 16-day gap does not. - Detect nine-beat signals only in the rule-development period from 2021-01-04 through 2022-12-30. The period from 2023-01-03 through 2023-12-29 is the final holdout. Until the complete entry and exit rules have been frozen, do not calculate or reveal its price direction, nine-beat signals, or returns.
- A signal is confirmed only after the close of the candle carrying number 9. Use the
adjusted_openof the next valid candle as the observation entry. Count that entry candle as candle 1, then use theadjusted_closeof valid candle 3, 5, 10, or 20 as the observation endpoint. Return equals “endpoint close ÷ entry open − 1.” An event without enough future data is excluded from that window, but it may remain eligible for a shorter complete window. - Random comparison dates must come from the same stock and the same development period. Draw only from valid dates with a complete future window, and exclude actual completed falling Nine-Beat Count dates. Treat a random date as an ordinary “signal completion date”: use the next valid candle’s open as the entry and the same endpoint rule for the return. For each stock and window, draw as many random dates per round as that stock has eligible nine-beat events. Do not draw the same date twice for one stock in the same round. Run 1,000 independent rounds for each window, and record the random-number tool and seed so the same implementation can be rerun. The course reference uses NumPy
default_rng, a base seed of20260903, and “base seed + window length” for each window. If you use another reproducible implementation, do not force the output to match the course decimals. - Ten valid candles is the primary observation window chosen in advance. The first weak-pattern threshold is: the actual 10-candle mean return must exceed both the 95th percentile and the median of the random experiments’ mean returns. Whether it passes or fails, do not describe the nine-beat count as “proven effective” or turn it into real-world investment advice.
Split the work into two stages. Complete only stage one now, then stop for my confirmation:
- inspect the data files and fields, then complete the data screen;
- use simple, manually constructed price sequences to test
t-4, equality interruption, direction changes, locking after 9, and continuation across a missing candle; - identify completed rising and falling Nine-Beat Counts in the development period;
- report the starting company count, exclusions and reasons, final company count, and totals for completed rising and falling Nine-Beat Counts;
- sample several representative signals from the fictional teaching data and draw charts labelled from 1 through 9, covering an ordinary completion, post-completion locking, a count crossing a data gap, and a direction change where possible;
- save a plain-language validation summary and PNG sample charts, then tell me where they are.
During stage one, do not calculate event returns or run the random-date comparison. Do not use the CSI 300 as a return benchmark. Do not add MACD, volume, market capitalization, industry, position sizing, fees, or slippage. Do not read or reveal 2023 prices, signals, or returns.
You may choose the program structure and filenames, and you may run any necessary internal checks. Do not treat program code as the main deliverable. When finished, explain in plain language what you checked, what you found, and what remains undone. Then stop and wait for me to inspect the chart samples.
Giving AI the complete rulebook in one message helps different readers begin this teaching experiment from roughly the same place. It does not mean real research must begin with one enormous prompt.
For your own idea, you can begin with a rough guess in everyday language. Through several rounds of conversation, ask AI to expose ambiguities and help you fill in the data, dates, comparison group, and calculation method. The important part is not saying everything perfectly on the first try. It is turning the final agreed rules into a clear, frozen version before calculating the result. If you want to change a rule after seeing the result, start a new study version instead of quietly rewriting the old experiment.
The rulebook is long. That does not mean you need to become a nine-beat expert.
Think of it as the full address on a shipping label: the courier needs the complete address, but you do not need to memorize the postal code.
The one checkpoint: did it count correctly?
The AI will run the data checks, internal tests, and signal detection by itself.
You do not need to read its program line by line. Look at two kinds of evidence.
The first is a short list of counts:
- how many fictional companies it read at the start;
- how many it excluded for long data gaps;
- how many remained;
- how many completed rising Nine-Beat Counts and falling Nine-Beat Counts it found.
The second is the set of charts.
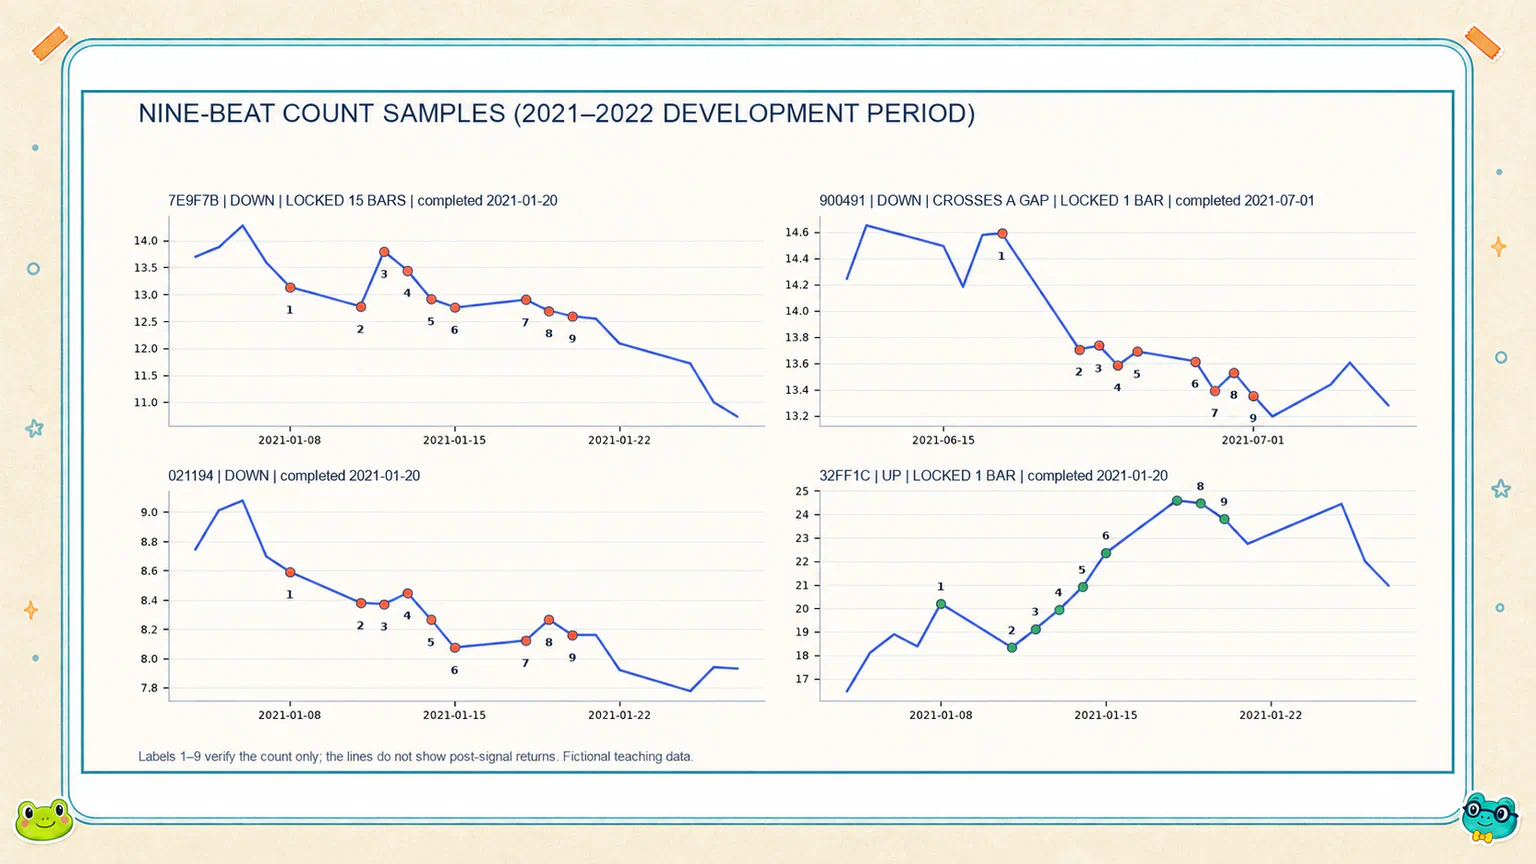
The AI should take several pieces of historical data and label the relevant candles from 1 through 9.
Check whether:
- the labels run continuously from
1to9; - each label uses the comparison four valid candles earlier;
- the program stops at
9instead of inventing10; - the chart has not obviously reversed the up and down directions.
If the chart is hard to check, choose one count and ask the AI to list each labelled candle’s date and close alongside the date and close four valid candles earlier. Have it walk you through the comparison; you do not have to guess from the picture.
You do not need to inspect more than two thousand signals. A few charts cannot prove that every signal is correct, but they can expose the most obvious misunderstanding.
With the current version of the teaching dataset, the course experiment produced these validation counts:
| Check | Course result |
|---|---|
| Fictional companies at the start | 300 |
| Excluded for a continuous gap strictly longer than 15 days | 8 |
| Eligible companies | 292 |
| Completed falling Nine-Beat Counts | 2,040 |
| Completed rising Nine-Beat Counts | 1,561 |
These are validation results from the course experiment. They are not numbers that the task brief asks your AI to imitate.
If you use the same dataset and rules, these deterministic counts should line up. If they differ materially, investigate the cause instead of asking the AI to replace its answer with the course numbers.
If the counts and sample charts show no obvious problem, one short reply is enough:
Continue the experiment
These chart samples show no obvious problem. Freeze the eligible-company list and nine-beat signals you just produced, and do not change the confirmed rules. Now calculate event returns over 3, 5, 10, and 20 valid candles. For each window, run 1,000 random-date comparisons using the same-stock method from the original task.
Report the eligible event count, mean return, median return, and positive-return share for each window. Also report the median and 5th–95th percentile range of the random experiments’ mean returns, and show where the actual result sits within the random results. Produce one readable comparison chart and save a plain-language research summary.
Do not read or reveal 2023 prices, signals, or returns. Do not add the CSI 300, MACD, volume, market capitalization, industry, position sizing, fees, or slippage. When finished, tell me where the outputs are and explain what the result currently supports and what it cannot support.
What did the experiment find?
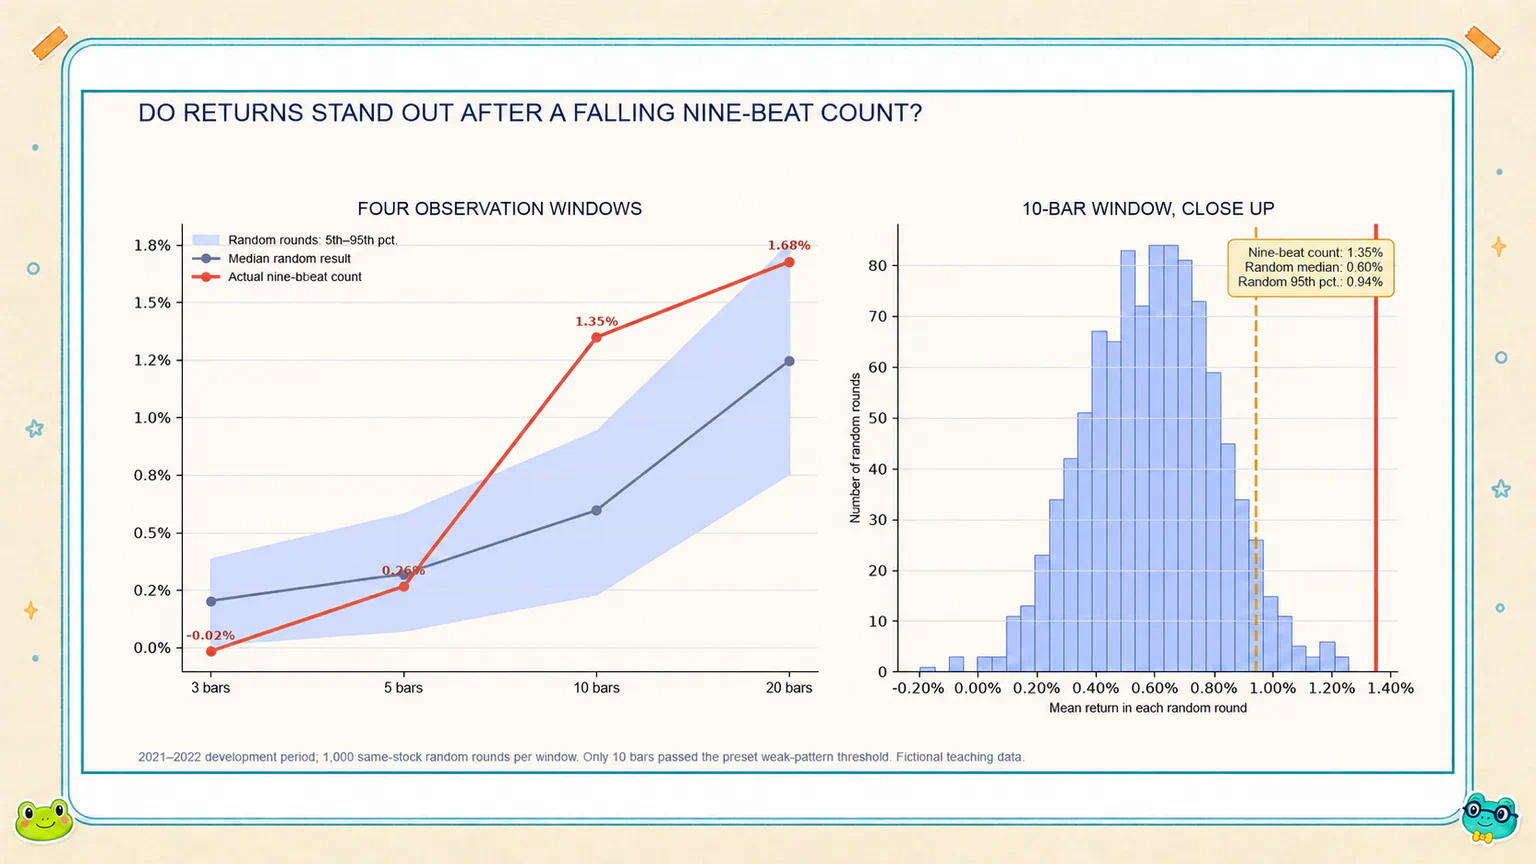
Using the course dataset and the fixed rules, the actual nine-beat events and random dates produced these results:
| Observation window | Eligible nine-beat events | Nine-beat mean return | Median random mean return | Random mean return, 5th–95th percentile |
|---|---|---|---|---|
| 3 candles | 2,016 | -0.02% | 0.20% | 0.01%–0.39% |
| 5 candles | 1,994 | 0.26% | 0.32% | 0.07%–0.58% |
| 10 candles | 1,908 | 1.35% | 0.60% | 0.23%–0.94% |
| 20 candles | 1,886 | 1.68% | 1.25% | 0.76%–1.75% |
The event count changes slightly across windows because some nine-beat counts near the end of the development period do not have enough future candles to complete the longer window.
The preselected 10-candle window stands out:
- the nine-beat mean return is
1.35%; - the median mean return across 1,000 random rounds is
0.60%; - 95% of the random mean returns are no higher than
0.94%; - the actual nine-beat result of
1.35%is higher than all 1,000 random rounds.
By the threshold fixed before the experiment, the 10-candle window shows a weak pattern worth investigating further.
The 3-, 5-, and 20-candle windows do not pass the same threshold.
The actual event counts and returns come from fixed data and fixed formulas, not random draws. With the same dataset and rules, they should line up.
The random-date results may differ slightly. Different AI assistants may use different random-number tools, candidate ordering, or sampling implementations. Even the same written seed does not guarantee identical dates across different implementations. What matters is that your own implementation produces the same result when rerun and that a reasonable change in the random sample does not easily reverse the main judgment.
Good news, but do not call it a strategy yet
Hoppy stares at 1.35% for a few seconds.
“So a completed falling Nine-Beat Count really is a chance to buy the dip?”
Dr. Hop shakes his head.
“We know only that, in the development period of this fictional dataset, the 10-candle result stood out relative to ordinary dates.”
“Isn’t that enough?”
“It is enough to continue the research. It is not enough to put real money at risk.”
We still have not seriously answered:
- whether a few huge gains pulled up the average;
- whether most events also performed better;
- whether many nine-beat counts clustered on the same market dates;
- how far an average event return is from an executable strategy.
Those questions deserve more than a rushed answer at the end of this lesson.
Next, we will put this piece of “good news” on the table and see why it is worth continuing—and why it still is not a strategy.
If your result looks materially different
Do not ask the AI to rewrite its answer, and do not paste the course numbers into the project and demand a match.
Send this instead:
Recovery prompt
I want to audit whether the nine-beat experiment I just completed followed the agreed rules. Read the data files, program, and summary actually used in the current project. Do not guess any external reference answer, and do not modify the rules merely to make the result look more plausible. Keep 2023 prices, nine-beat signals, and returns sealed.
Audit the calculation chain from the raw data onward. In order, report: the data package, fields, and date range actually read; company and date counts; the exclusion process for any continuous gap strictly longer than 15 market trading days; the forward-adjusted field; the t-4 comparison, equality interruption, direction change, and post-completion lock; the entry after signal confirmation; the counting of the 3-, 5-, 10-, and 20-candle windows; and the actual company, signal, event, and nine-beat return totals left at each stage.
Then audit the random-date method separately. Confirm same stock, matched count, complete future window, exclusion of actual nine-beat completion dates, and no duplicate date within the same stock and round. Record the random-number tool, candidate-date ordering, and seed actually used. Run the same program twice and compare the results.
Finally, produce an audit table with at least these columns: stage, rule used, actual result, anomaly found, and possible impact. If you find a problem, identify the earliest stage where it appears and explain the repair in plain language. If you do not find a problem, state whether small random-result differences would change the current judgment. Do not modify the program or research outputs until I confirm.
This prompt cannot promise a one-message cure for every problem.
Its job is to make the AI audit what it actually did and locate the earliest possible divergence—not pretend it knows the course answer and polish the final numbers around it.
If you still need a line-by-line comparison after the independent audit, explicitly paste the reference numbers you want to compare. Audit first and compare second, so the reference answer does not anchor the AI’s reasoning from the start.
What did we actually complete?
We did not learn to hand-code a nine-beat detector, and we did not produce a trading strategy.
We completed something more useful:
Give AI the complete rules
→ Confirm that AI found the nine-beat count we defined
→ Compare nine-beat dates fairly with ordinary dates
→ Find a bounded weak pattern worth investigating further
AI handled the data, algorithm, repeated sampling, and charts.
You kept control of the research question, checked the critical samples, and decided how far the conclusion could go.
In this fictional teaching dataset, the 10-candle result after a completed falling Nine-Beat Count stood out relative to random dates. That makes it worth further research, but “slightly better than random dates” is not yet a tradable strategy.
Lesson discussion
Share a question, insight, or different view—and see how other learners are thinking.