Lesson 1
Does an 8 in a Stock ID Bring Better Luck?
Turn a casual lucky-number idea into a research hypothesis with fixed rules that data is allowed to challenge.
Hoppy opened the candlestick chart from the previous lesson one more time.
The virtual company was called “Dawntower Green Solutions,” and its stock ID was 003382.
He meant to admire his first chart. Instead, his eyes stopped on one digit in the ID.
“There is an 8 in it.”
Hoppy stared at it for a moment.
“Eight sounds lucky. Could stocks with an 8 in their ID really be more likely to rise?”
Dr. Hop did not laugh, and he did not dismiss the idea.
He pulled over a blank sheet of paper and wrote one question at the top:
Did companies with an 8 in their stock ID perform better in the past than companies without one?
“That still sounds a little silly,” Hoppy said.
“It might be,” Dr. Hop replied. “But before quantitative research decides that an idea is silly, there is something more useful we can do.”
“Test it?”
“First, say exactly what you want to test.”
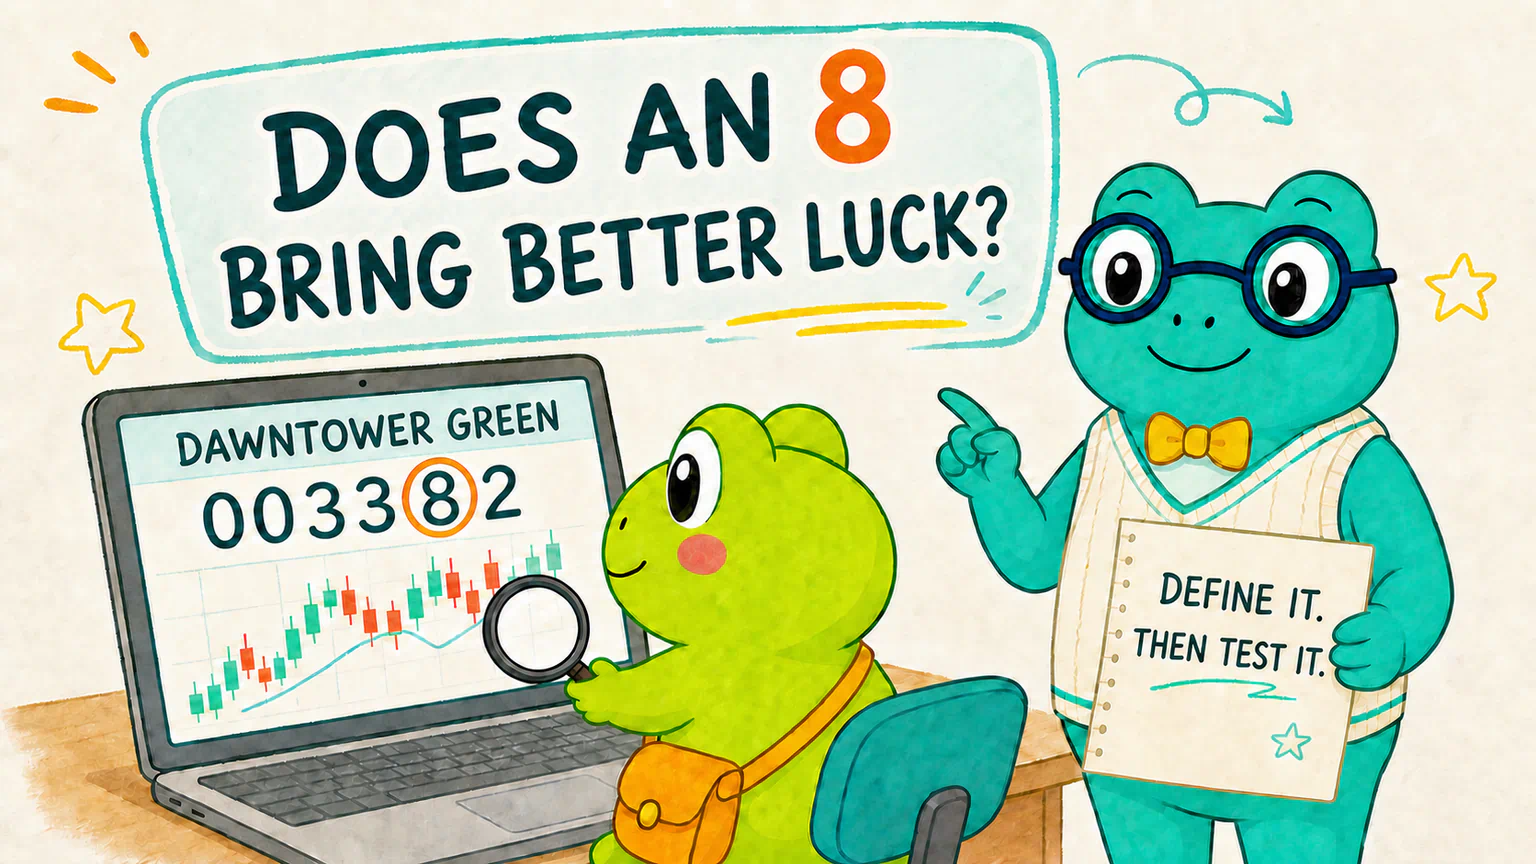
In Chinese-speaking cultures, the number 8 is often associated with luck and prosperity. That cultural association gives us the idea for this lesson; it is not evidence that the number affects stock returns. The Chinese and English versions both test the same digit and the same data.
A hunch, a question, and a hypothesis are not the same thing
Hoppy began with a hunch:
An 8 in the stock ID sounds lucky.
That is a perfectly good place to begin. But it does not tell us whom to compare or what “luckier” is supposed to mean.
Push the hunch one step further and it becomes a research question:
Did companies with an 8 in their stock ID perform better in the past than companies without one?
Now we can write down a clear guess:
In the Hoppy fictional teaching dataset, companies whose stock IDs contain the digit 8 had better overall price performance during our chosen historical period than companies whose IDs did not contain 8.
That is the hypothesis we are going to test.
A hypothesis is not a proven answer, and it is not a bet that must win. It is simply our guess, written down before we look at the data.
The evidence may support it. The evidence may argue against it. It may even give us a frustratingly mixed answer.
None of those outcomes makes the research a waste of time.
A testable hypothesis must allow the evidence to say, “You may be wrong.”
A hypothesis is not enough
Hoppy looked at the hypothesis and thought the job was done.
Dr. Hop had another question.
“Suppose the 8 group has a higher average return, but fewer companies actually go up. Which group wins?”
“Then we use the average?”
“What if the average looks weak but the median looks better?”
“We could use the median.”
“And if neither one helps, shall we try the number 6 instead?”
Hoppy went quiet for two seconds.
“That sounds like a good way to keep shopping until I find an answer I like.”
Exactly.
If we see the result before deciding how to form the groups, which dates to use, or which numbers count as evidence, research can quickly become an answer-shopping trip.
Imagine that Hoppy predicts the blue team will win the 100-meter race at a school sports day.
The blue team loses, so he says:
“I meant the 200-meter race.”
They lose that one too, and he says:
“Actually, I was judging which team had the better uniform.”
If Hoppy can keep moving the finish line, he can never lose. The race can never answer his original question either.
So after we write the hypothesis, we must draw the track before the race begins: who competes, what period counts, how we will examine performance, and what we will leave out this time.
That is what it means to fix the rules in advance.
Let us set the rules before the race
Hoppy and Dr. Hop put the entire experiment on one sheet of paper.
- What we compare: only virtual companies in the Hoppy teaching dataset. No real stocks are involved.
- How we form the groups: an ID containing the character
8joins the “contains 8” group; every other ID joins the “no 8” group. - The first period: 2021-01-04 through 2022-12-30.
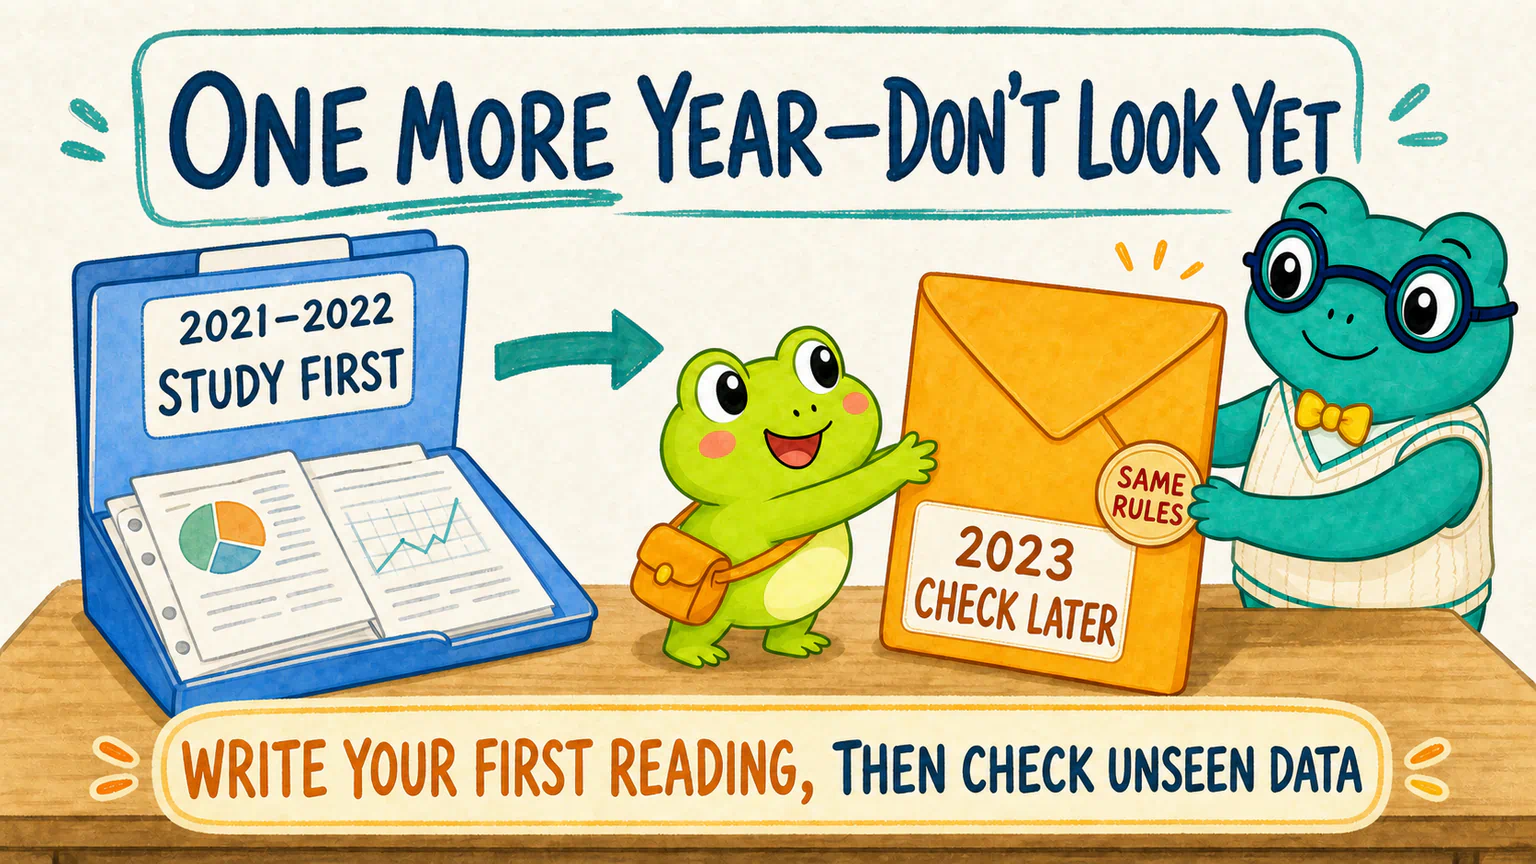
- The period we hold back: 2023-01-03 through 2023-12-29 stays out of the first result. We will open it only after writing our initial reading.
- Who can take part: a company must have usable adjusted closing prices at the start and end of both comparisons. This keeps the same companies in the first check and the later check.
- What we examine: group size, mean return, median return, and the share of companies with a positive return. We will also look at the highest and lowest values for unusually extreme companies.
- What we leave out: no switching to
6,9, or another digit; no industry, market-cap, or P/E filters; and no comparison with the CSI 300.
This agreement is not here to make a small experiment sound grand.
It protects one simple question. Once the results appear, we cannot quietly change the digit, move the dates, or keep only the statistic we like best.
If mean, median, and positive-return share still sound unfamiliar, do not worry. We will unpack them when they appear in the actual results.
One more year of data—do not open it yet
The teaching package contains three years of daily data.
We will use the first two years for the initial comparison. For now, we will put the 2023 data in a sealed envelope.
Hoppy reached for it. Dr. Hop held the envelope down.
“But 2023 already happened. Why can’t we look at all of it now?”
“Because once you have seen an answer, it can change the way you frame the question.”
We will first study the earlier period and write down our initial reading. Then we will ask:
Could the difference have appeared by chance in those first two years?
At that point, we will not change the digit, dates, calculation method, or statistics. We will take the same rules and test them on 2023.
The temporarily unseen data acts like a second check on the first result.
It cannot predict the real future for us. It can at least show whether the same claim still stands when we move to a different slice of data.
Next, we will walk through the whole research loop
So far, we have only a hypothesis and an experiment agreement. We have not seen a single return result.
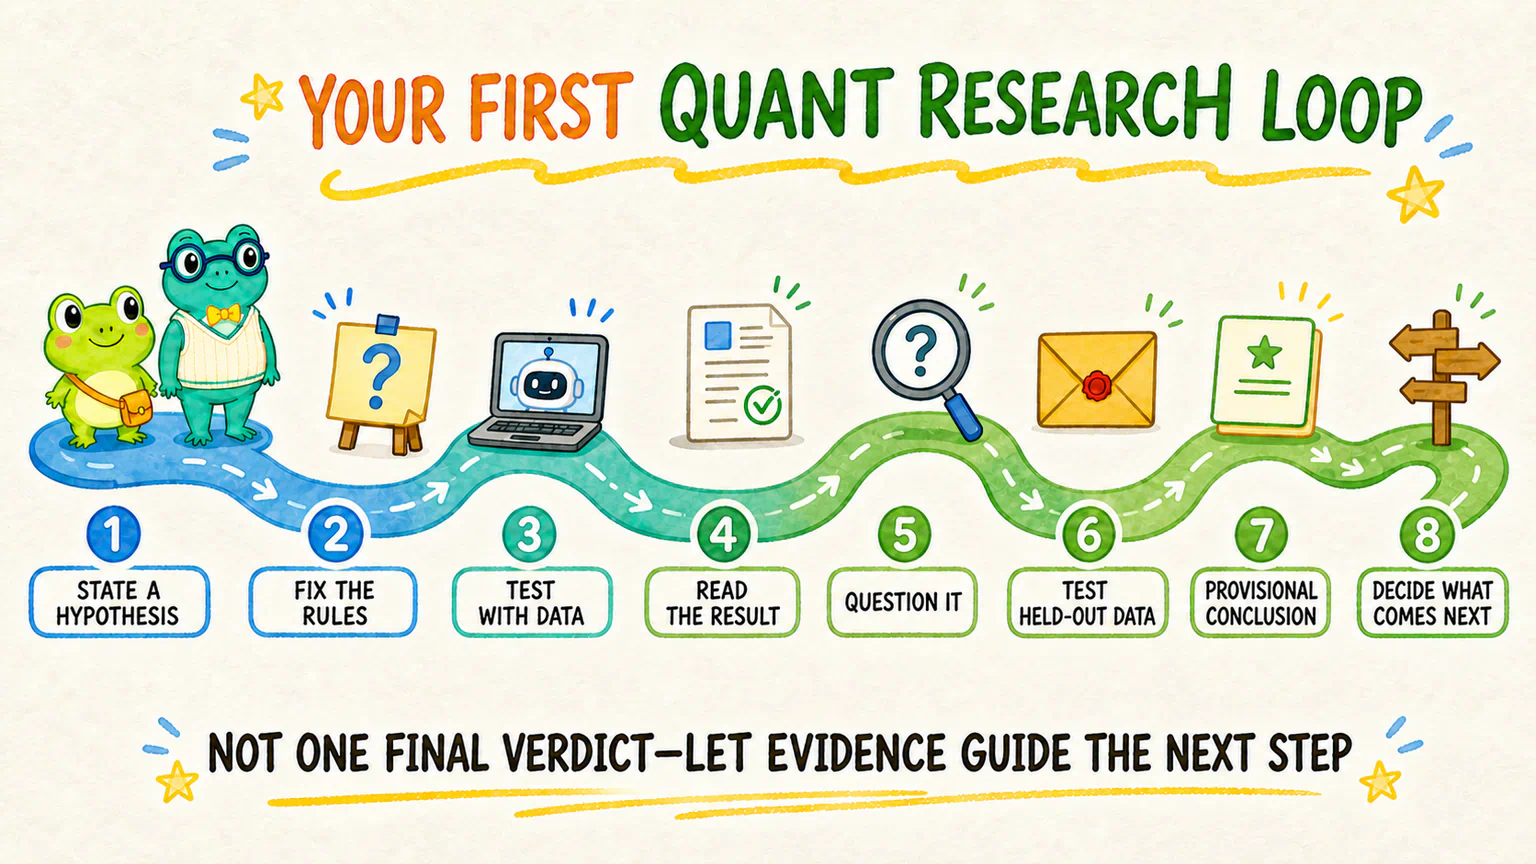
Here is the path ahead:
State a hypothesis
→ Fix the rules
→ Ask AI to test them with data
→ Read the results
→ Question the results
→ Test again on the held-out data
→ Write a bounded, provisional conclusion
→ Decide whether the clue should continue, change, or stop
Today, we are standing at the first two steps.
Next, AI will use this agreement to divide the virtual companies into two groups and calculate the first two years of results.
When those results appear, we will not rush to announce that “8 works” or that the whole idea was nonsense. We will first ask what the mean, median, positive-return share, and extreme values are each telling us.
Finally, we will open the envelope containing 2023 and check whether the earlier difference still appears in another period.
Once both pieces of evidence are on the table, we will make one final decision: keep observing the clue, turn a new question into a new study, move into a fuller backtest, or stop here.
Hoppy placed the hypothesis and rules beside the keyboard, then put the 2023 envelope in a drawer.
“So our job is not to prove that 8 has magic powers?”
“No,” Dr. Hop said. “We write down a guess, then give the evidence a fair chance to disagree.”
Hoppy nodded.
The question had not become more correct.
It had become testable.
We do not search the data for a fun story. We state a hypothesis that the evidence is allowed to reject, then fix the rules for judging it.
Lesson discussion
Share a question, insight, or different view—and see how other learners are thinking.