Lesson 4
Ten Heads in a Row—What Comes Next?
Keep the original grouping and return calculation unchanged, then use held-out data to see whether the earlier observation repeats.
At the end of the previous lesson, the envelope containing the 2023 data was still sitting on the desk.
A few new sticky notes lay beside it. Hoppy and his AI had filled them with follow-up questions:
- What if we tried a different digit?
- What if we examined the extreme companies separately?
- Could industry membership affect the comparison?
They were interesting questions, but Hoppy had not acted on them.
The next day, he sat down and reached straight for the envelope.
“We can finally open it now, right?”
“Yes,” said Dr. Hop. “But before you do, how will you judge what comes out?”
Hoppy already had an answer.
“If the contains-8 group does better again in 2023, then 8 really works. If it does not repeat, the earlier result was just luck.”
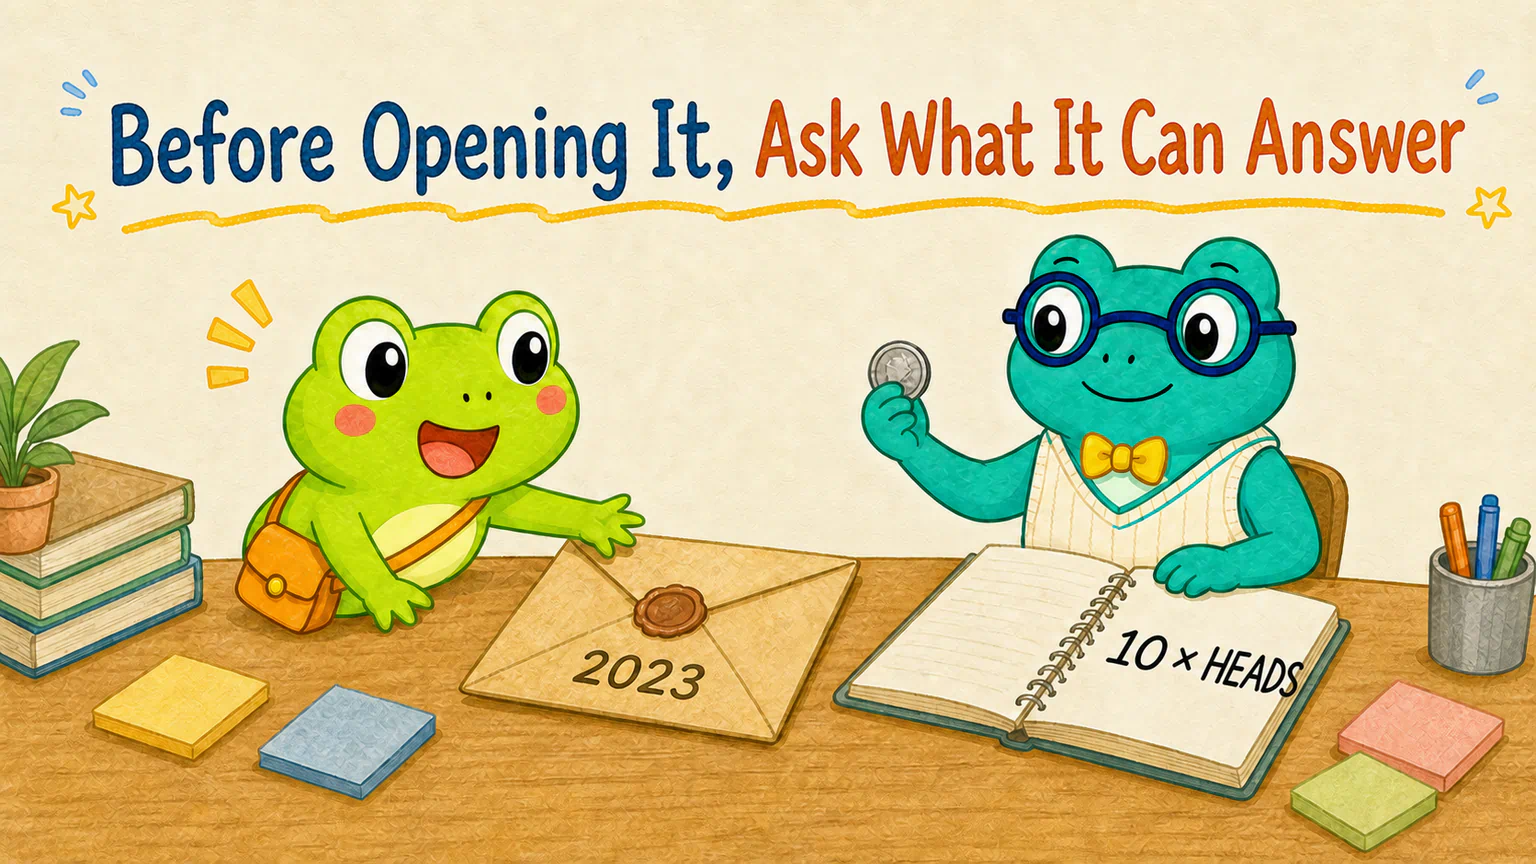
Dr. Hop did not agree or disagree. He took a coin from his pocket and opened his notebook.
“I tossed this ten times last night. Here is the record.”
Across the page, he had written:
Heads, heads, heads, heads, heads, heads, heads, heads, heads, heads.
“Ten heads in a row?” Hoppy stared at the page. “Then it feels like the eleventh toss should be heads too.”
“The first ten have happened. What about the eleventh?”
“We have not tossed it yet.”
Dr. Hop pointed to the envelope.
“Past results can help us form a guess, and new results can test that guess. Neither one automatically gives the future a certificate that says ‘this will always happen.’”
Hoppy’s hand stopped on the envelope.
“So even if the 2023 result repeats, we still cannot declare that 8 works?”
“Right. And if it does not repeat, that does not make the earlier numbers fake.”
“Then what can this envelope tell us?”
“Let’s open it and find out. Data does not have to follow the plot we prepared for it.”
We are not opening the envelope to see whether 8 can win again. We are learning how data that played no part in the earlier analysis can check something we found in history.
The envelope is not a verdict
Hoppy’s first idea sounds natural: repetition means success; no repetition means failure.
New data is rarely that tidy.
New data is more like another witness. It may support the earlier finding, object to it, or give us a mixed answer.
If the same direction appears again, the earlier finding gains support. If it does not repeat, our confidence should fall. If some parts repeat and others do not, we keep the disagreement visible. The new evidence changes how much confidence is reasonable; it does not stamp the original idea “approved” or decide what will remain true forever.
A rare result is not a permanent rule
Return to the coin for a moment.
Ten heads in a row is unusual, but unusual does not mean impossible.
We can say:
This coin just produced ten heads in a row.
That describes something that happened.
Now compare it with this claim:
This coin has only one side, so the next toss must also be heads.
We have jumped from recording the past to guaranteeing the future.
Stock data creates the same temptation. When one group has a higher mean return in a historical period, it is easy to turn “we saw a difference” into “this feature will work again.”
The problem is simple: the past is already on the table. The future is not.
Holding back data from the early analysis gives the original finding one fresh check. That is more credible than repeatedly rewriting the rules on the same history.
What if you show only the luckiest attempt?
Now make the coin experiment larger.
Imagine a room full of people tossing coins and recording their results. One person alternates heads and tails. Another gets three heads in a row. Someone else starts with a tail.
At the end, we photograph only the person who got ten heads in a row and quietly remove everyone else’s record.
The photograph is real.
It just does not show you the whole room.
A digit experiment can mislead us in the same way.
Suppose we test every digit from 0 through 9, split the companies ten different ways, and keep only the digit with the largest mean-return gap. We could then write:
I always suspected this digit was special.
That is not a clean test of an idea proposed in advance. It is choosing the nicest answer from a pile of results and writing the story afterward.
We did not run the 8 experiment that way. Before seeing the result, we fixed the digit, sample, dates, and measures.
That still does not turn the first difference into a permanent rule. Even a single, preselected comparison can produce a difference by chance.
Now we can reveal a secret about the dataset
Every company and stock ID in the Hoppy teaching dataset is fictional.
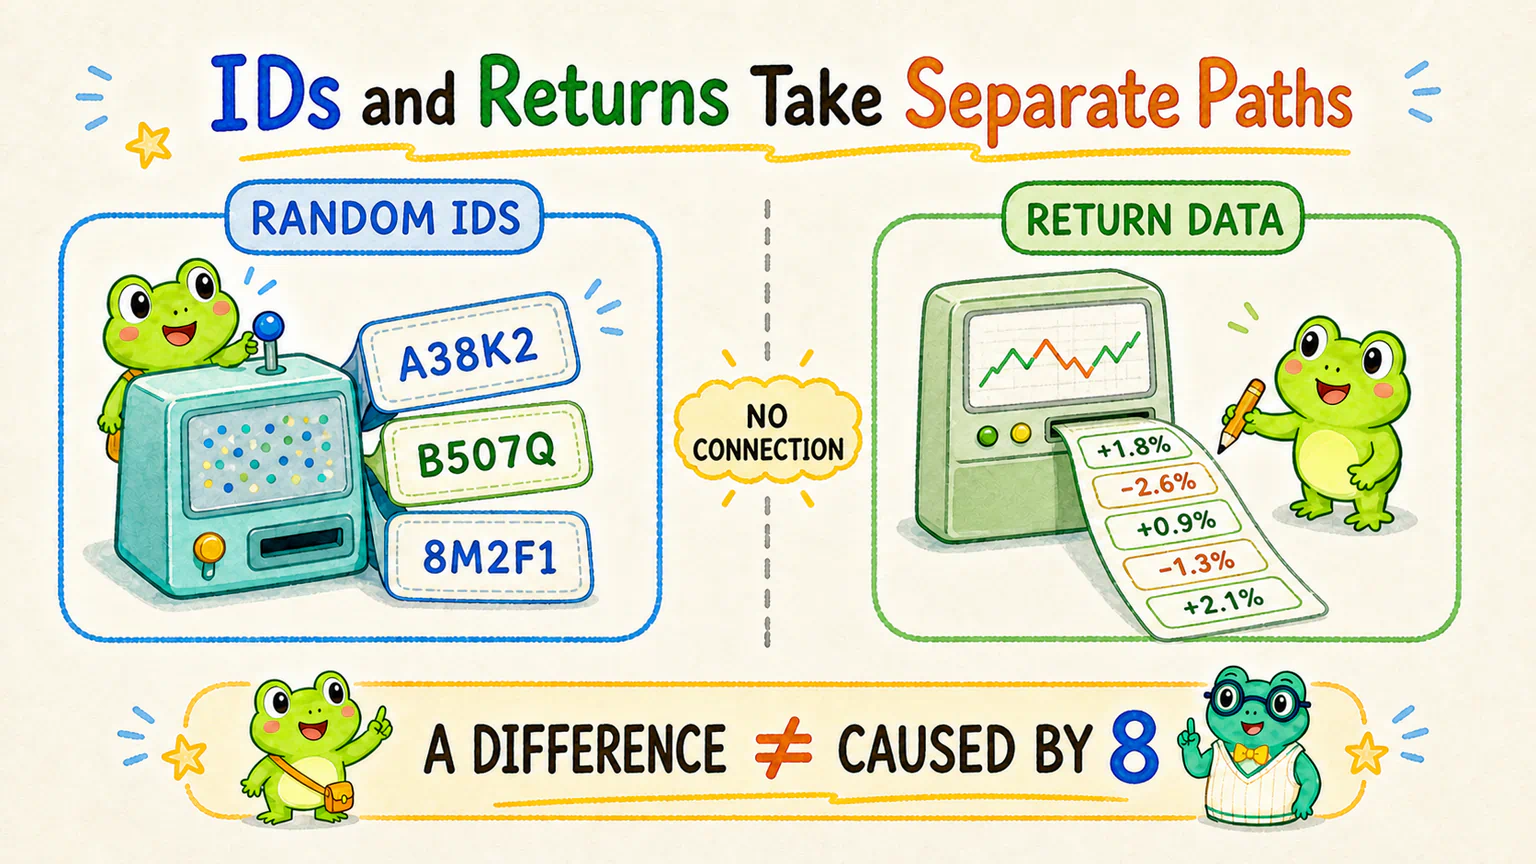
The IDs were generated randomly, independently of company returns.
In other words, the character 8 has no hidden route through which it can push a price up or down.
Does that make the first two years of results fake?
No.
The contains-8 group really had a mean return of 19.88%, and the no-8 group really had 14.90%. The medians, positive-return shares, and extremes were also calculated from the teaching data.
We need to separate two statements:
- A difference appeared in the data. That describes this history.
- The character
8created the difference. That is a causal explanation.
The first statement can be true while the second has no support.
That is what makes this example useful. We know the IDs and returns were generated independently, yet a finite stretch of history can still produce group differences that look surprisingly convincing.
Put new questions aside and keep the old agreement fixed
We can now explain why the sticky notes from the opening must wait.
Trying another digit, isolating extreme companies, or adding other conditions are all questions that appeared after we saw the first result.
If we use them to change the experiment before opening the 2023 envelope, we will no longer be checking the original “does the ID contain 8?” question.
Hoppy puts the sticky notes into a box labeled “ask later.”
The questions are not forbidden. They simply do not belong in this check.
Only the original agreement stays on the desk:
- Use the same 294 fictional companies;
- Keep 91 companies in the contains-8 group and 203 in the no-8 group;
- Continue to group only by whether
asset_idcontains the literal character8; - Fix the holdout period at 2023-01-03 through 2023-12-29;
- Keep the return formula as ending
adjusted_closedivided by startingadjusted_close, minus 1; - Report the mean, median, positive-return share, maximum, and minimum for both groups;
- Do not add another digit, industry, market capitalization, PE, or the CSI 300;
- Whatever happens, do not rewrite the original study summary.
One more detail matters.
The original study period is almost two years long. The holdout period is almost one year. Because those windows have different lengths, we should not compare 19.88% directly with 3.76% and announce that “the contains-8 group got worse.”
Our question is narrower: within each period, did the relative difference between the contains-8 and no-8 groups repeat?
Ask the AI to restate the rules before opening the envelope
If you start a fresh Codex conversation, the task must stand on its own. The AI will not automatically remember the envelope we sealed earlier.
Do not ask it to calculate immediately. First, have it inspect the files and restate the fixed design.
Give this to your AI research assistant | Restate the holdout rules
This project already contains a study of whether a fictional stock ID includes the character 8. First, read the existing study summary and related analysis files. Confirm the fixed sample, group definition, dates, and return formula used in the original study.
Next, we will run a holdout-period check using the same 294 fictional companies. The contains-8 group must remain fixed at 91 companies, and the no-8 group at 203. Do not reselect companies or change group membership.
Fix the holdout period at 2023-01-03 through 2023-12-29. Calculate each company’s holdout return with the same formula: ending adjusted_close divided by starting adjusted_close, minus 1.
For each group, the holdout report must still include company count, mean return, median return, positive-return share, maximum return, and minimum return. Place those results beside the original study-period results. Clearly state that the two periods have different lengths, so their cumulative return levels should not be used to decide which period “performed better.”
Do not test another digit. Do not add industry, market capitalization, PE, the CSI 300, or any other condition. Do not modify the original study summary.
Do not calculate yet. In plain language, restate how you will preserve the same companies, groups, and formula. Tell me which files you actually found and whether anything is ambiguous, then stop and wait for confirmation.
The most important part of this task is not “calculate 2023.”
It is the three uses of same: the same companies, the same groups, and the same return formula.
Once the AI’s restatement matches the agreement, tell it:
Your restatement matches the original experiment. Keep those rules unchanged and run the holdout check.
Let the AI open the envelope without writing the ending first
The AI can now calculate the holdout-period results.
Give this to your AI research assistant | Run the holdout check
Using the fixed rules we just confirmed, calculate holdout-period returns for 2023-01-03 through 2023-12-29.
Confirm again that both periods use the same 294 companies, the same group membership, and the same endpoint-return function. For the contains-8 and no-8 groups, report the holdout company count, mean return, median return, positive-return share, maximum return, and minimum return.
Place the holdout results beside the existing original study-period results. Focus on the direction and size of the difference between groups within each period. Do not compare cumulative return levels across periods as if the windows had equal lengths.
Save a plain-language holdout summary and a PNG comparison chart. In the chart, compare the two groups’ mean returns, median returns, and positive-return shares across the original study and holdout periods. Keep the maximum and minimum returns in the written summary instead of crowding them into the chart.
Do not modify the original study summary. Do not test another digit or add a causal claim, future forecast, trading recommendation, or unrequested condition.
You may choose the program structure, but you must run it and verify the result. When finished, give me the file locations and explain which results repeated and which did not.
We have not scripted a line that says “the validation succeeded” or “the validation failed.”
If the data is tidy, we record a tidy answer. If it is mixed, we record the mixture.
The three measures did not hold up the same sign
Using the current Hoppy fictional teaching dataset and the fixed rules, the completed run produced these results:
| Group | Period | Companies | Mean return | Median return | Positive-return share | Maximum | Minimum |
|---|---|---|---|---|---|---|---|
| Contains 8 | Original study | 91 | 19.88% | -0.50% | 49.45% | 368.76% | -66.99% |
| Contains 8 | Holdout | 91 | 3.76% | 2.17% | 52.75% | 143.05% | -55.46% |
| No 8 | Original study | 203 | 14.90% | -1.65% | 46.80% | 625.12% | -63.98% |
| No 8 | Holdout | 203 | 5.36% | -0.07% | 49.75% | 252.39% | -61.56% |
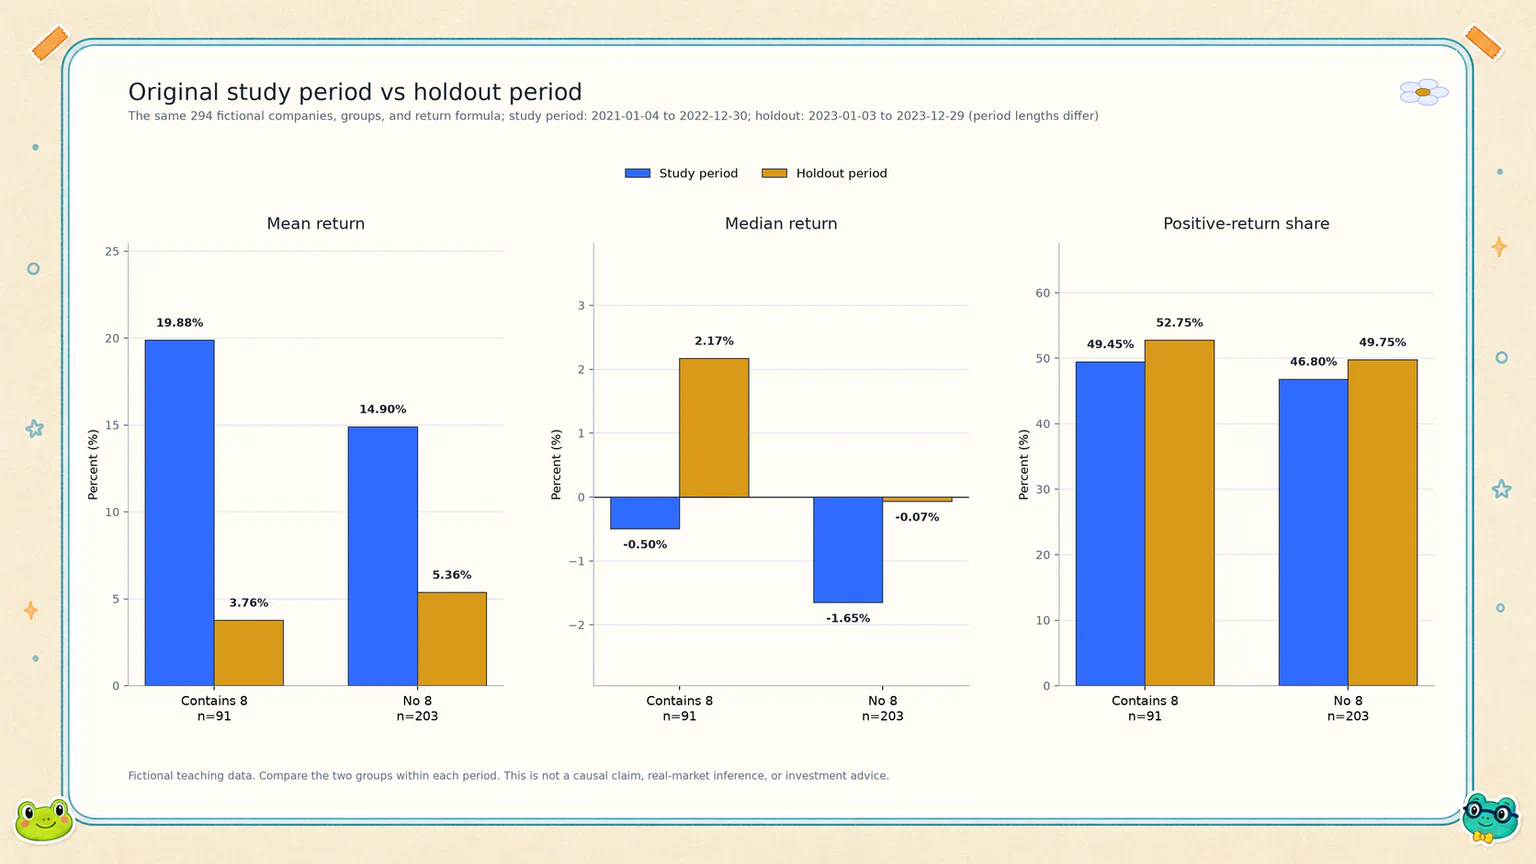
If we ask, “Did the finding repeat?” the most honest answer is: partly yes, partly no.
Start with the mean.
- In the original study period, the contains-8 group was 4.98 percentage points higher;
- In the holdout period, it was 1.60 percentage points lower.
The direction of the mean-return gap reversed.
Now look at the median.
- In the original study period, the contains-8 group was 1.16 percentage points higher;
- In the holdout period, it was 2.24 percentage points higher.
The relative ordering of the medians repeated.
Finally, consider the positive-return share.
- In the original study period, the contains-8 group was 2.65 percentage points higher;
- In the holdout period, it was 2.99 percentage points higher.
That ordering repeated too.
The three measures did not hold up the same sign.
That does not mean the experiment broke. It is the answer the data gave us.
Why we cannot announce that “8 won two out of three”
Hoppy studies the table and holds up two fingers.
“Two of the three measures point the same way. Can we at least say that 8 won two-thirds of the contest?”
“Did we define that two-out-of-three rule before seeing the result?” asks Dr. Hop.
“No.”
“Then it is a brand-new rule.”
The mean, median, and positive-return share are not three judges voting on one winner. They answer different questions. We also never agreed in advance that two matching directions would count as a pass.
More importantly, we know the IDs were generated randomly and independently of returns.
Even if all three measures had kept the same direction in the holdout period, that would only tell us that a similar descriptive pattern appeared again in this finite fictional dataset. It would not prove that the character 8 pushed returns higher. A holdout check is more credible than repeatedly adjusting a rule on the original period, but it does not turn association into causation.
Put both pieces of evidence into one provisional conclusion
If we keep only our favorite result, we can write either of two opposite slogans:
The medians and positive-return shares repeated. The digit 8 works after all.
Or:
The mean-return gap reversed. The entire earlier study was wrong.
Both slogans trim the evidence until it looks too neat.
A conclusion that fits the current result is:
In the Hoppy fictional teaching dataset, the contains-8 group had a higher mean return than the no-8 group in the original study period, but a lower mean return in the 2023 holdout period. The relative ordering of the medians and positive-return shares remained the same across both periods. The holdout therefore produced a mixed result rather than a cleanly repeated pattern. Because the fictional IDs were generated randomly and independently of returns, these differences describe only this teaching dataset. They do not show that the character 8 caused higher returns and cannot be extended to real markets, future performance, or a trading rule.
This conclusion does not deny any number we calculated.
It simply refuses to make the numbers carry a claim they cannot support.
Ask the AI to check the holdout work
Now we need to check whether the old rules stayed fixed, the new results were recorded completely, and the conclusion speaks no louder than the evidence.
Check it with Codex
Read the original study summary, holdout summary, and two-period comparison chart for this fictional stock-ID study. Do not reselect companies, modify the rules, or add a new analysis.
In plain language, check the following:
- Did both periods use the same 294 companies, the same 91/203 group membership, and the same return formula?
- Were company count, mean return, median return, positive-return share, maximum, and minimum recorded accurately for both periods?
- Does the current conclusion state both that the mean-return direction reversed and that the median and positive-return-share directions repeated?
- Does the lesson say that the periods differ in length and that their cumulative returns should not be compared directly?
- Does the lesson use the known fact that the IDs were random and independent of returns to avoid turning a descriptive difference into a causal claim?
- Does the conclusion overreach into a real-market claim, future forecast, or trading recommendation?
If you find a problem, report its exact location and explain why before changing anything. If everything is consistent, briefly restate what this study can and cannot tell us.
The main output is still not a program we need to memorize.
It is a research summary that preserves the question, fixed rules, two pieces of evidence, and conclusion boundary—plus a chart we can inspect.
The eleventh toss is heads too
The results from the envelope are now safely recorded.
Hoppy picks up the coin from the opening and finally makes the eleventh toss.
The coin spins across the desk and settles.
Heads again.
Hoppy pauses and looks at Dr. Hop.
“Can I say the next one must be heads now?”
“You can record the eleventh toss,” says Dr. Hop.
He slides the notebook back across the desk.
“Just do not let it speak for the twelfth.”
The 2023 holdout result is similar.
Some directions repeated and one did not. We record all of them without asking any number to guarantee the future.
Hoppy puts down the coin and looks back at the finished summary.
“But we formed a hypothesis, fixed the rules, and even checked a separate period.”
“After all that, we still cannot say that 8 works—and we certainly cannot promise future profit.”
On a clean sheet of paper, he writes one more question:
If quantitative research cannot guarantee the future, what is it actually for?
This time, Dr. Hop does not answer immediately.
“That question deserves a lesson of its own.”
A holdout check does not certify a pattern. It gives data that played no part in the earlier analysis a chance to support, challenge, or add nuance to the original finding.
Lesson discussion
Share a question, insight, or different view—and see how other learners are thinking.