Lesson 2
Ask AI to Divide 300 Companies into Two Groups
Have AI restate the experiment agreement before grouping 300 fictional companies and saving inspectable results.
Hoppy placed the experiment agreement beside his keyboard and opened his AI research assistant again.
“We wrote the hypothesis and fixed the rules. Can we finally calculate something?”
Dr. Hop nodded.
“Yes. But do not let it start running just yet.”
“Another delay?”
“Not a delay. We need to make sure the race AI sees is the same race we designed.”
Hoppy looked down at the agreement.
A simple instruction such as “separate the companies whose IDs contain 8” leaves room for several interpretations. Is 8 a character or a number? Should AI use raw closing prices or adjusted closing prices? Should it force companies with missing endpoint data into the calculation? Should it open the 2023 results too?
If AI gets one of those details wrong, the program may still run perfectly. It may even produce a handsome chart.
The problem is that the chart would be answering a different question.
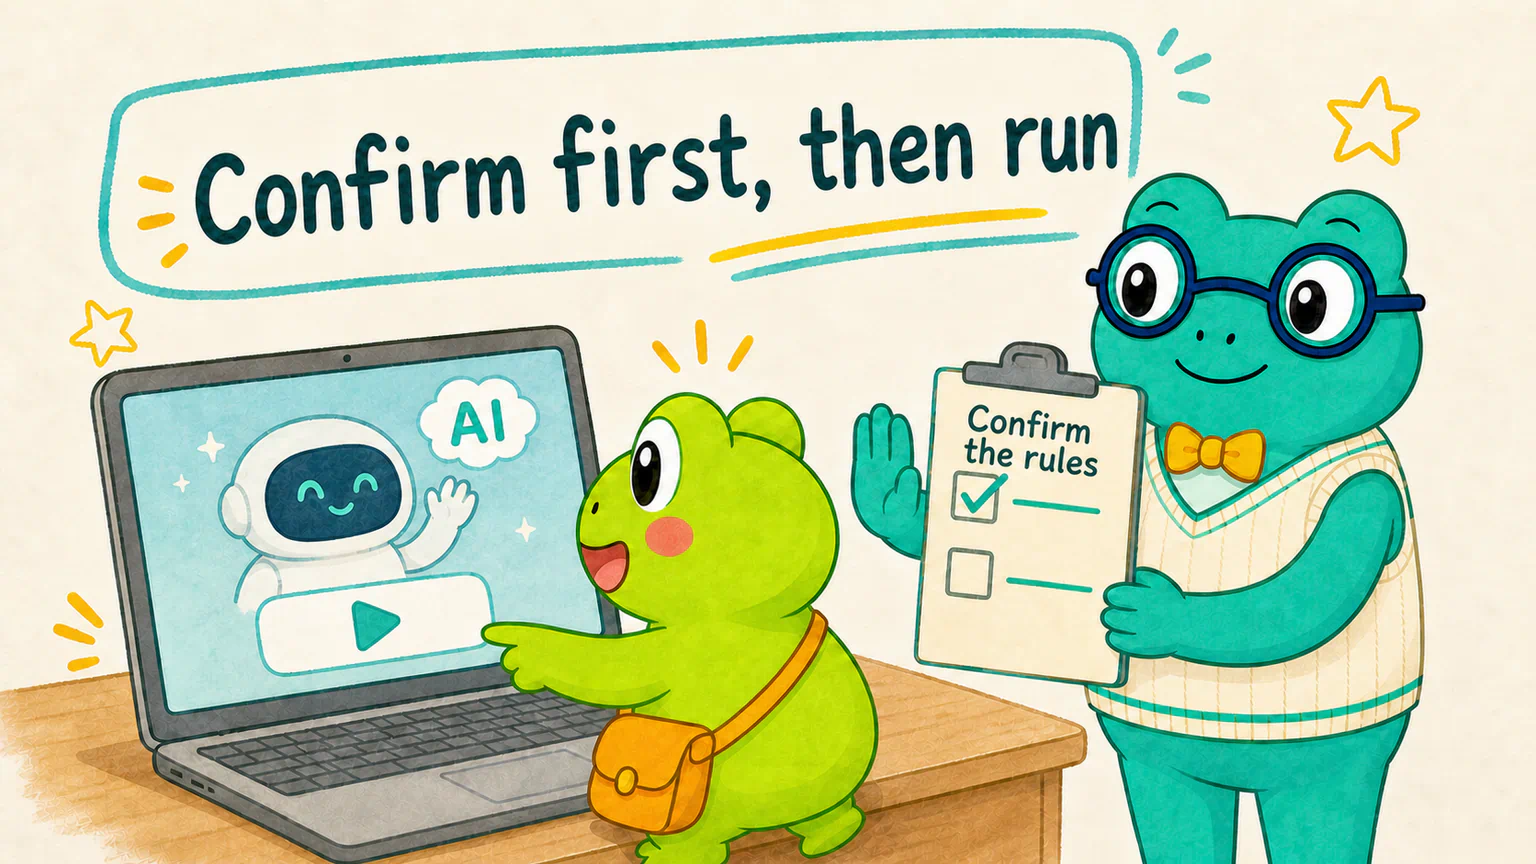
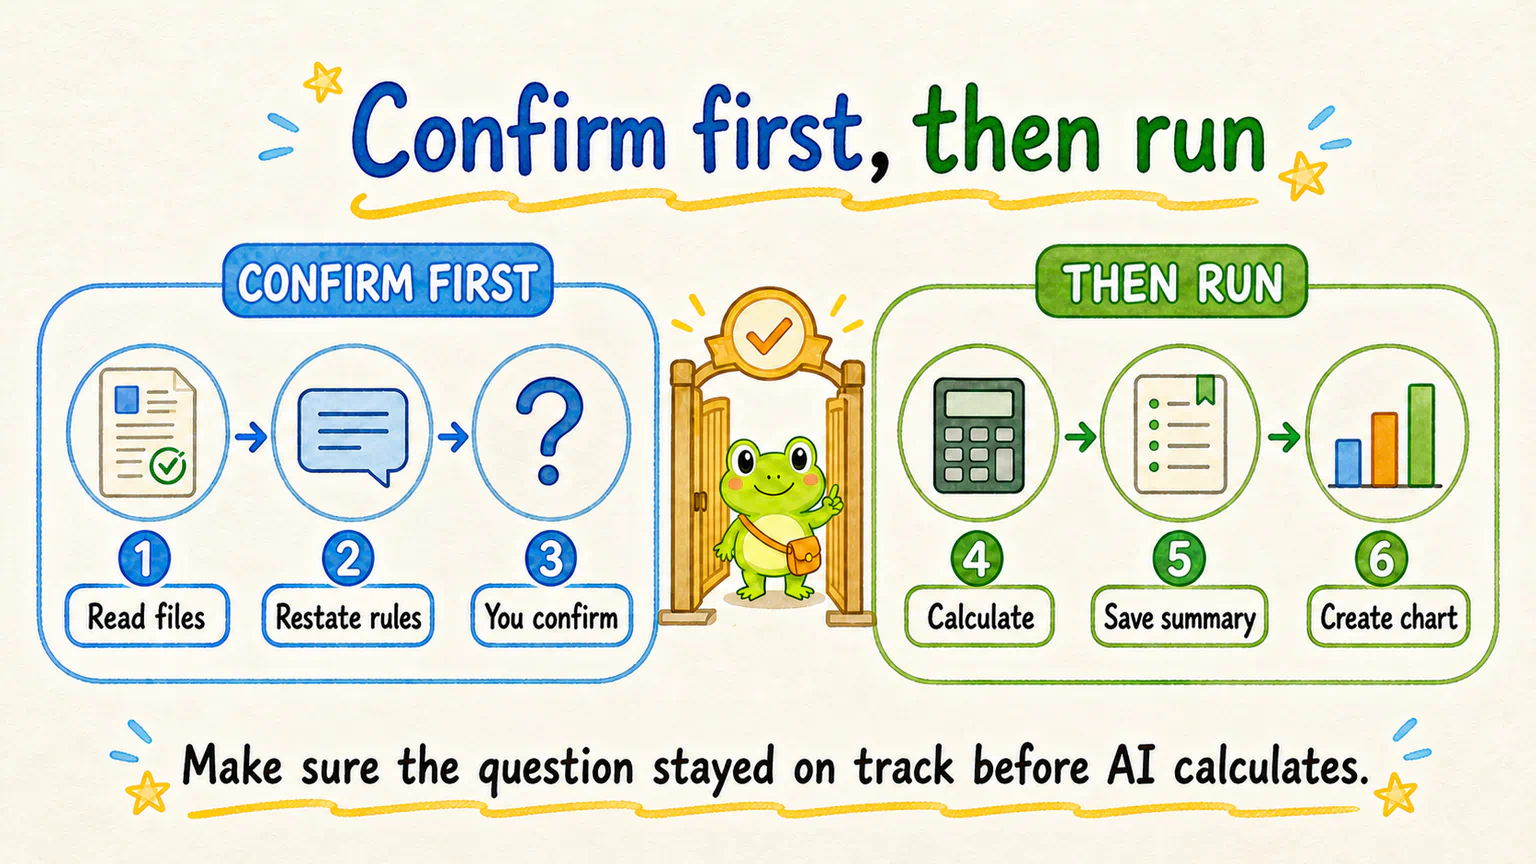
After giving AI a research task, do not wait passively for “Done.” Ask it to restate the plan first. Confirm that the rules are still intact, then let it calculate.
Start a fresh conversation with a clean desk
Open the local lab folder from the previous lesson, then start a new Codex conversation.
If Codex is not available to you, open the same folder in WorkBuddy. The entry point may change; the research task does not.
Why start a new conversation?
The old one contains environment setup, a small game, data inspection, and a candlestick chart. Those tasks have already done their jobs. A clean conversation makes it easier to see whether AI is focusing only on the study in front of us.
A new conversation does not automatically know what we discussed earlier.
It has never seen our experiment agreement or the envelope holding the 2023 data. The next instruction therefore needs to make sense on its own. “Calculate what we just discussed” is not enough.
First, do not calculate—ask AI to restate the plan
We will split the task into two parts.
The first part asks AI to inspect the real files, confirm the available fields, and explain in plain language how it intends to run the experiment.
Give this to your AI research assistant|Inspect and restate
The root of the current project should contain a folder named hoppy-teaching-dataset. First read its README.md, data_dictionary.json, and manifest.json. Then inspect the actual fields and date ranges in companies.parquet and stock_daily.parquet.
Do not calculate group returns or create a chart yet. Only confirm whether the data can support the study below, then restate in plain language how you plan to carry it out:
- The study covers virtual companies in the teaching dataset.
- If an
asset_idcontains the character8, place the company in the “contains 8” group. Otherwise, place it in the “no 8” group. - The first study period is 2021-01-04 through 2022-12-30.
- A company is eligible only if it has a usable
adjusted_closeon all four endpoints: 2021-01-04, 2022-12-30, 2023-01-03, and 2023-12-29. The two 2023 endpoints are used only to check eligibility. Do not calculate, compare, or report 2023 returns. - Calculate the study-period return as the
adjusted_closeon 2022-12-30 divided by theadjusted_closeon 2021-01-04, minus 1. - Report each group’s company count, mean return, median return, positive-return share, maximum return, and minimum return. “Positive return” means a study-period return strictly greater than 0.
- Do not test another digit. Do not add industry, market cap, P/E, the CSI 300, or any trading rule.
Tell me which files, fields, and dates you actually found and whether they satisfy these requirements. If anything is ambiguous or missing, explain it first. Stop after restating the plan and wait for my confirmation. Do not calculate the result yet.
This is longer than “please calculate it,” but it is not an exercise in writing a formal technical specification.
It simply settles four ordinary questions: whom are we studying, how do we form the groups, which period do we examine, and what evidence should remain at the end?
Those four questions will still matter when you investigate a completely different market idea.
What should you listen for in AI’s restatement?
AI may use different words or choose a different program structure. It does not need to repeat our instruction word for word.
What matters is whether it preserved the important pieces:
- it forms the groups by whether the ID contains the character
8; - the first calculation covers only 2021-01-04 through 2022-12-30;
- it calculates returns from the endpoint change in adjusted closing prices;
- it keeps the same eligible companies for the first and later checks;
- it treats the 2023 endpoints only as an availability check, rather than calculating 2023 returns early;
- it does not quietly add another digit, industry, market cap, P/E, or the CSI 300.
One detail may sound contradictory.
If we are “not looking at 2023 yet,” why can AI inspect two dates from 2023?
It is checking whether each company has the admission tickets needed for the later comparison. It may verify that the records exist. It may not calculate how much the company rose or fell in 2023, and it may not reveal either group’s 2023 performance.
We fixed this eligibility rule before seeing the result. We are checking whether the data can carry out the rule, not peeking at the answer.
If AI’s restatement matches the experiment agreement, confirm it clearly:
Your restatement matches my research agreement. Continue with exactly these rules. Do not add or modify any condition.
If something remains vague, do not fill in the gap on AI’s behalf. Point to the unclear sentence and ask it to restate that part.
Once the rules match, let AI calculate
Now AI can read the data, implement the calculation, and actually run it.
Give this to your AI research assistant|Run the study
Carry out the study using the rules we just confirmed.
First select the companies that satisfy all four endpoint requirements. Then divide them into two groups according to whether asset_id contains the character 8. Calculate and report only the return from 2021-01-04 through 2022-12-30. Do not calculate, compare, or reveal any 2023 return in any output.
Report the initial company count, eligible company count, excluded company count, and reasons for exclusion. For each group, report company count, mean return, median return, positive-return share, maximum return, and minimum return. Use a consistent percentage unit and round displayed values to two decimal places.
Save two pieces of research evidence in the current project’s output directory:
- A plain-language Markdown research summary that records the question, fixed rules, dates, actual sample size, group results, and current limits.
- One PNG result chart comparing the groups’ mean return, median return, and positive-return share, with both group sample sizes clearly shown.
Put the maximum and minimum values in the written summary rather than crowding them into the chart. The chart should display the actual numbers only. Do not add claims such as “8 works” or “buy this group,” and do not add the CSI 300, industry, market cap, P/E, trading markers, or 2023 data.
You may choose the program structure and filenames, but you must actually run the program and verify that the summary and chart come from the same calculation. When finished, tell me where the files were saved and explain in plain language what you did. Do not ask me to read or explain the program code.
This task does not dictate a Python filename or require your project to look exactly like the course example.
The program is a tool AI uses to complete the work. What we want to keep is the question, the rules, and the evidence.
Not all 300 companies have to enter the race
The teaching dataset contains 300 virtual companies.
But appearing in the dataset is not the same as being eligible for this comparison.
If a company is missing an adjusted closing price at any required endpoint, we cannot apply the same first and second comparison rules to it. The company remains in the original data; it simply cannot take part in this experiment.
The process is therefore:
300 companies register
→ Check four admission tickets
→ Keep the common eligible sample
→ Divide it into contains-8 and no-8 groups
Do not ask AI to guess, fill, or invent missing prices just to force the sample back to 300.
A smaller sample does not automatically mean the program failed. We need to know who was excluded and why.
What did our run actually produce?
Using the current Hoppy teaching dataset and exactly the rules above, 294 of the 300 virtual companies had usable data at all four required endpoints.
Of those:
- 91 IDs contained
8; - 203 IDs did not contain
8; - the remaining 6 companies were excluded because they had no record at the 2023-12-29 eligibility endpoint.
Here are the study-period results:
| Group | Companies | Mean return | Median return | Positive-return share | Maximum return | Minimum return |
|---|---|---|---|---|---|---|
| Contains 8 | 91 | 19.88% | -0.50% | 49.45% | 368.76% | -66.99% |
| No 8 | 203 | 14.90% | -1.65% | 46.80% | 625.12% | -63.98% |
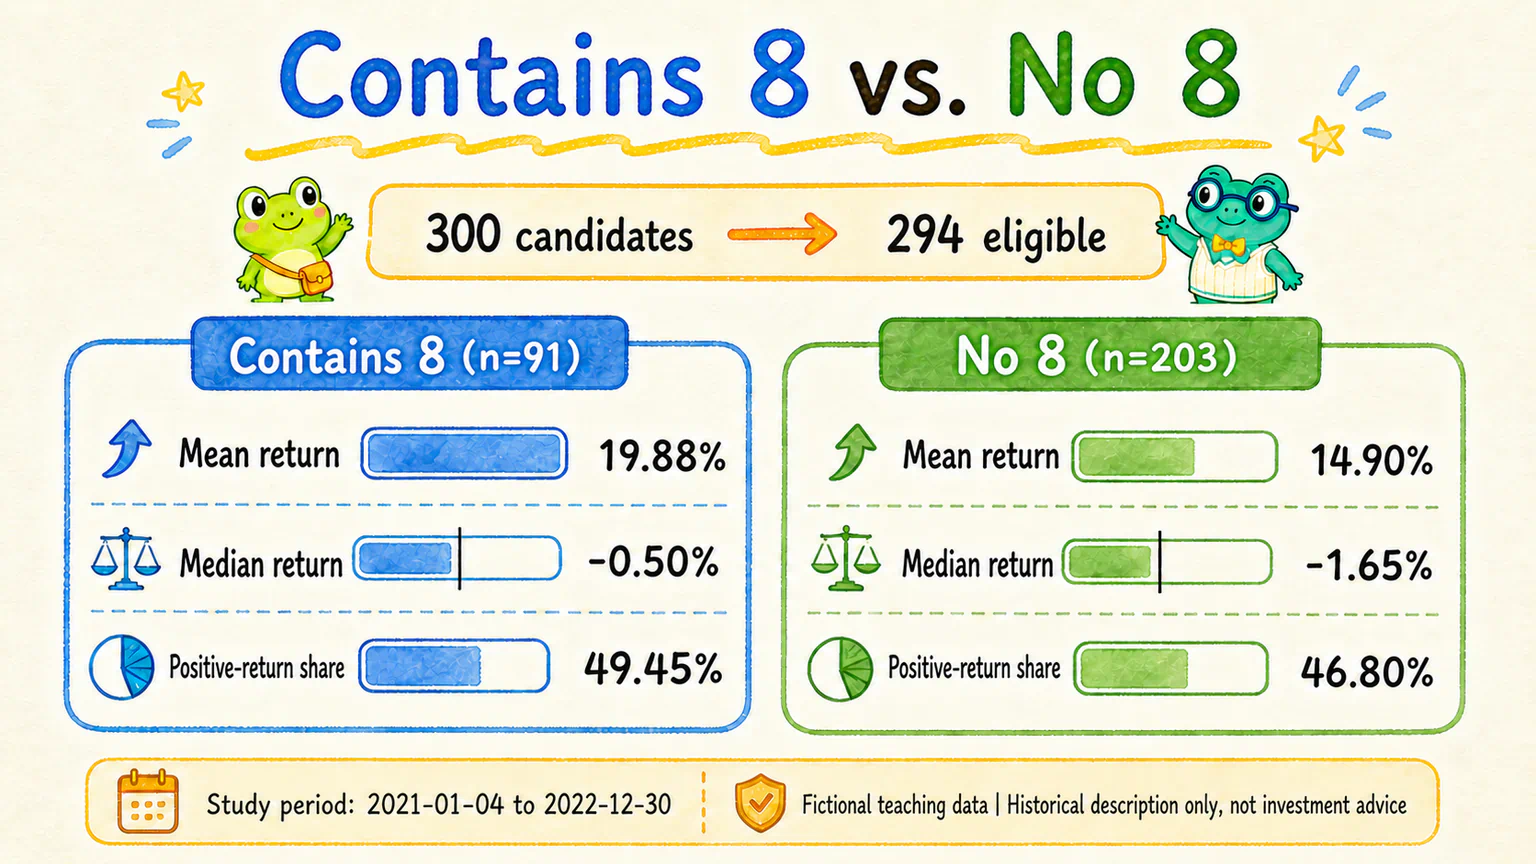
These are example results produced from the current version of the course dataset. They are not target numbers that AI should be told to imitate.
If you use the same data package and rules, the basic numbers should agree. If they do not, investigate the data version, fields, dates, grouping rule, and return units. Do not tell AI to edit its result until it matches the course.
This guided research round will continue with the Hoppy fictional teaching dataset because the next lessons interpret the numbers above together. You are welcome to repeat the method with your own data, but treat that as a parallel exercise: the example numbers, charts, and conclusions in the following lessons will no longer match line by line.
Whichever dataset you use, the real check is whether the study followed the research rules—not whether everyone’s chart looks identical.
If your result differs, do not ask AI to guess the answer
Some of the most useful moments in hands-on research begin when a result looks odd.
AI cannot find the data
First confirm that the downloaded package was extracted into the lab root. Do not let AI search online for a different dataset with a similar name.
You can ask:
Inspect the current project structure and tell me which dataset folder and required files you actually found. Do not download or create substitute data. First explain exactly where the missing files need to be placed.
Your sample size differs from the course example
Do not begin by telling AI that the answer must be 294.
Ask:
Do not change the original rules or imitate the course numbers. List the four endpoints you actually used, the eligibility rule, every excluded company and its specific reason, and confirm that
asset_idwas treated as a string.
AI opened 2023 too early
Do not pretend you did not see the result, and do not continue discussing it.
Say:
This step should not calculate or report 2023 returns. Keep the original grouping and eligibility rules, remove all 2023 return results from the summary and chart, and rebuild only the output for 2021-01-04 through 2022-12-30.
The chart and summary disagree
Do not start by adjusting colors or layout.
Ask:
Check whether the written summary and chart come from the same calculation. Compare the two group sizes, mean returns, median returns, and positive-return shares one by one. Fix numerical inconsistencies before changing the chart design.
These follow-up questions do not solve every possible error for you. They protect one habit: find the step that departed from the agreement, then deal with that specific problem.
AI says it is done—open the files yourself
Start with the plain-language research summary.
Check whether it actually records:
- the research question and grouping rule;
- the study period and the temporarily held-back period;
- the actual eligible sample and reasons for exclusion;
- the complete results for both groups;
- no trading recommendation or promise that a historical difference will continue.
Then open the result chart.
Make sure both group names, sample sizes, and three main statistics are readable, and that the chart agrees with the summary.
If you want AI to help with one more verification pass, use this:
Check it with Codex
Do not recalculate the study or modify any file. Read the research summary and the data used by the result chart, then verify these items one by one: the study period is correct; no 2023 return appears in the output; the two group sizes add up to the eligible sample; and the chart’s mean returns, median returns, and positive-return shares match the written summary exactly.
If anything is inconsistent, identify the exact mismatch and recommend a repair. Do not modify the files until I confirm.
AI’s self-check cannot replace opening the files yourself, but it can turn “does this look right?” into a much more useful inspection.
We have numbers, but not a conclusion
Hoppy opened the result chart and immediately noticed the two mean returns.
“The contains-8 group has 19.88%. The no-8 group has 14.90%.”
He turned around, eyes bright.
“So 8 won?”
Dr. Hop did not nod.
“Look at the medians.”
Hoppy checked again.
“Both are negative.”
“Now look at the positive-return shares.”
“Those are only a little different.”
Several numbers in the same result table are not telling exactly the same story.
That does not mean the calculation failed. It means we finally have a result worth reading carefully.
AI has calculated the data, but calculated is not the same as understood. Once the numbers exist, our next job is not to declare a winner. It is to ask what each number is actually telling us.
Lesson discussion
Share a question, insight, or different view—and see how other learners are thinking.