Lesson 1
We Beat the Index. Who Gets the Credit?
Meet benchmarks, market exposure, beta, and alpha while learning why beating an index does not by itself prove a strategy worked.
After finishing the study, Hoppy opened the summary again.
He circled “outperformed the CSI 300 over the same period” and started adding a note: Nine-Beat Count must be doing something right.
“We didn't make money, but at least we did better than the market, right?”
“We did. We've checked that result,” said Dr. Hop. “But are you giving Nine-Beat all the credit?”
“Who else would get it?”
“We also chose an industry. And sometimes the account held no stock. Could either of those matter?”
Hoppy looked at his note and held off on saving it.
This time, we're not asking whether the program got the arithmetic wrong. We're asking something more: what might help explain the account's result?
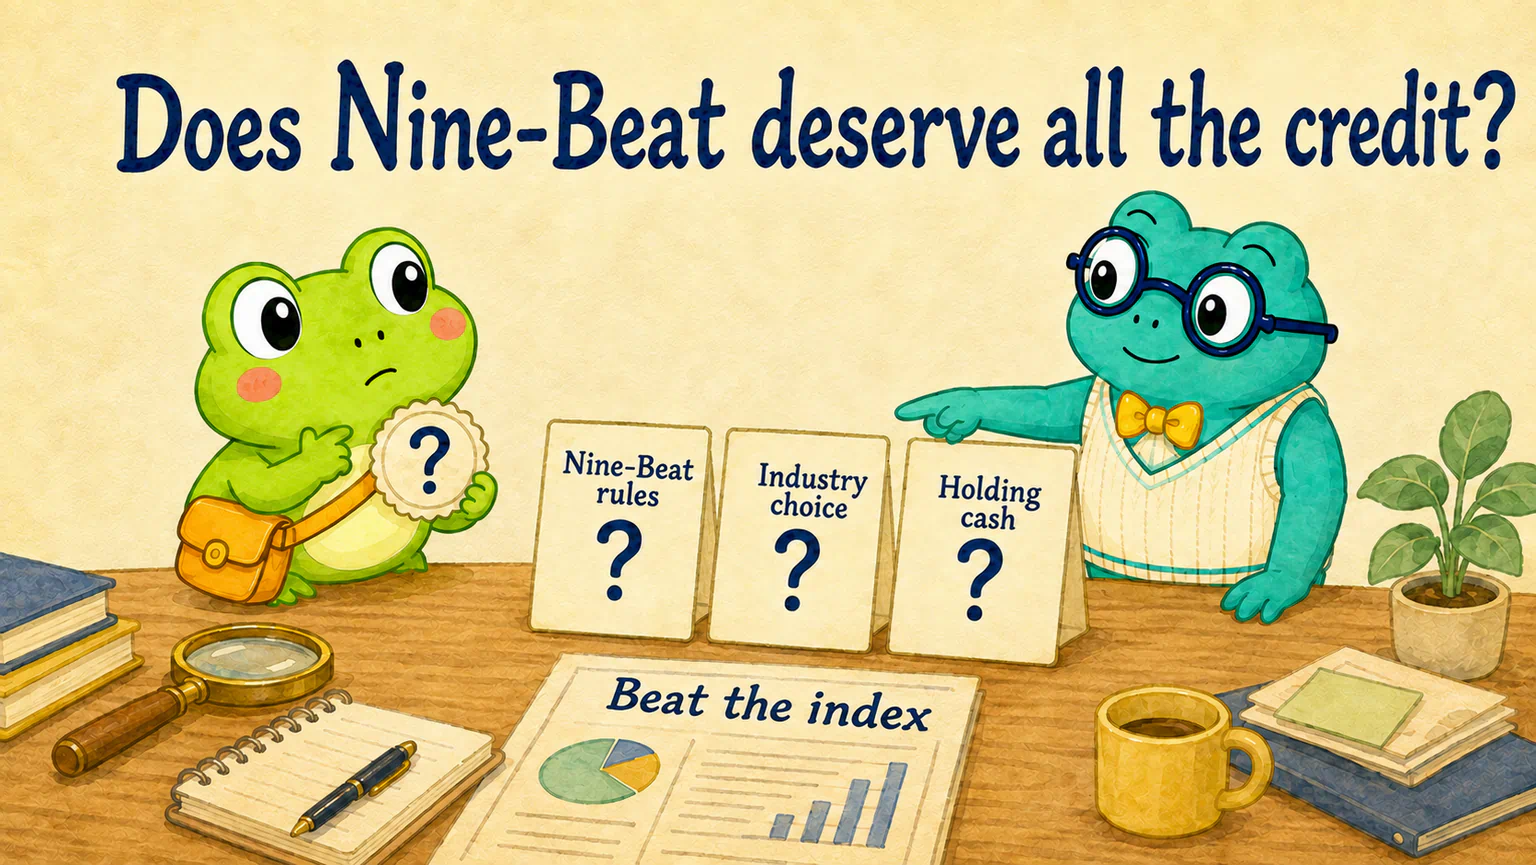
We continue with the fictional teaching companies and the CSI 300 reference from our China A-share-based examples. The English edition keeps the same study, rather than switching to US stocks. Research methods can travel across markets; data conventions and trading rules still need checking.
Outperforming doesn't tell us who deserves the credit
Start with a simple possibility.
During a stretch when the market keeps falling, an account that holds cash much of the time might lose less than one that stays invested in stocks. It could beat the index without having especially accurate entry signals.
The reverse matters too. When the broad market rises, an account's profit isn't necessarily all down to stock-picking skill.
Now return to our study. Did the chosen teaching industry matter? Did the times when the account held stock—or cash—matter? What part did the Nine-Beat rules play?
Those are questions we could investigate. We haven't measured their individual contributions. A plausible explanation isn't the same as an established cause.
“So was comparing with the CSI 300 a waste of time?”
Not at all. It told us whether we earned more, or lost less, than the CSI 300 over that period. Now we want to understand that performance better.
We have the result. We haven't handed out the credit yet.
A model doesn't have to predict tomorrow
“Sounds like we need a model,” said Hoppy. “Are we training another AI?”
No need to start there.
We can begin with a simple idea: some of the account's return may be related to the market's overall movements. Put the account's returns beside the market's returns for the same dates and see whether there's a reasonably stable relationship.
For example, we could write a simple formula describing how much the account tends to move when the market moves, then check how well it explains the records. That's one way to build a model.
It could be simple, or include other factors such as industry. What matters isn't how impressive the formula looks. It's what it includes, what it leaves out, and which question it tries to answer.
So a model isn't necessarily a machine for predicting tomorrow's prices. It can also help explain what has already happened.
Here, we're not asking it to name tomorrow's stock pick. We're asking how the account's return relates to the market.
How much does it move with the market?
Different accounts can react differently as the market moves.
Some tend to rise and fall quite strongly alongside it. Others move in the same direction, but less sharply.
One common number for describing this sensitivity is beta. We need a specific market reference—such as the CSI 300—to compare against. Beta describes the account's relationship with that reference, not a score for every risk the account faces. CFA Institute: Understanding common investment risk measures
For now, remember the question: when the market moves, how much does this approach tend to move with it?
“Tend to” matters. This describes a relationship in a set of observations, not a contract promising a fixed move every day.
Before doing the arithmetic, think of another choice: leaving money in a bank account to earn interest instead of buying stocks.
That helps introduce the risk-free return: a baseline return the model assumes you can earn without taking risk. The bank account is an analogy, not a claim that every deposit is completely risk-free.
Let's use an invented example. To keep the arithmetic simple, set that baseline return to 0%. That's an assumption for this example, not a claim that real-world interest rates are all zero.
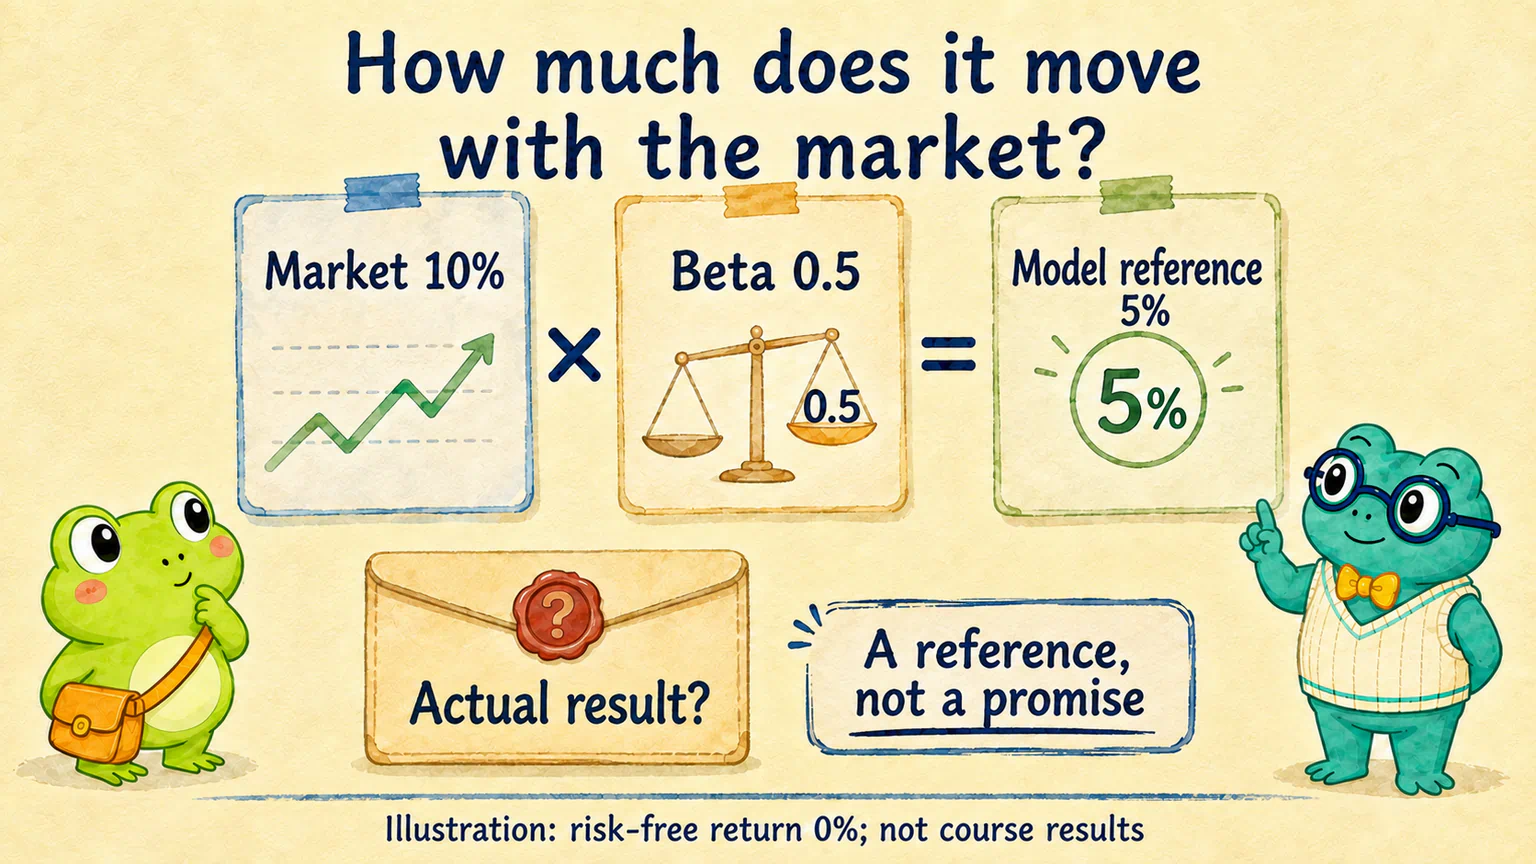
Now assume the account has a beta of 0.5. In this simple model, the part that moves with the market is calculated at half the market's return. If the market earns 10%, the model gives us a 5% comparison point. We'll call that the “model reference.”
The 0.5 is a given assumption here. In research, beta is estimated from multiple return observations. Dividing one day's account return by that day's market return doesn't establish beta.
“So the account definitely earns 5%?”
No. The 5% is a number calculated under this model for comparison—not a promise. The actual return could be higher or lower.
How can the same 8% receive two different evaluations?
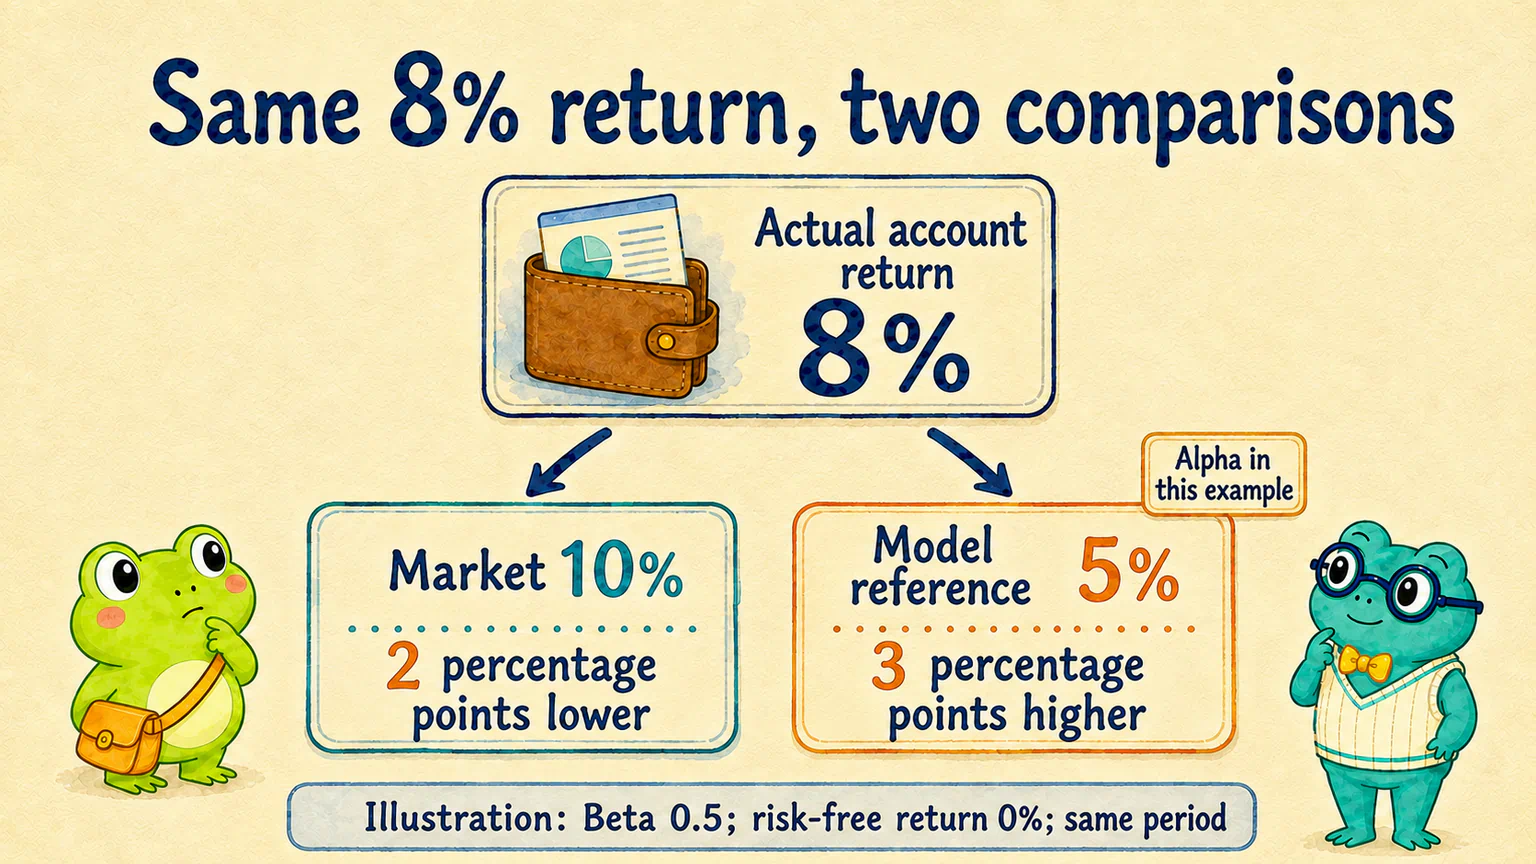
Continue with that example. Suppose the account actually earns 8%.
Compare it with the market first: the market earned 10%, while the account earned 8%. The account is 2 percentage points behind.
Now compare it with the model reference: the model gave us 5%, while the account earned 8%. The account is 3 percentage points ahead.
| Compare the same 8% with… | Result |
|---|---|
| The market's 10% | 2 percentage points lower |
| The model reference of 5% | 3 percentage points higher |
All these numbers are a simplified illustration, not results from our Nine-Beat experiment. Returns cover the same period; assumed beta is 0.5 and the assumed risk-free return is 0%.
“Was that good performance or bad performance?”
The two statements don't contradict each other. The first asks who earned more. The second first considers how much the account tends to move with the market, then asks whether it earned something extra.
That second comparison introduces alpha.
In this example, we don't subtract the market's 10% from the account's 8%. We subtract the model's 5%. The extra 3 percentage points are alpha calculated under this model. The question is “How much more did it earn than the model's reference?”—not “How much more did it earn than the index?” CFA Institute: The calculation behind this form of alpha
We use one period here to make the difference between the comparisons easy to see. Evaluating a strategy takes more observations: did it earn extra once, or does that extra performance keep appearing? One positive number can't answer that.
Want to see where the 5% comes from? Expand this
The simple model works like this:
Model reference return = risk-free return + beta × (market return − risk-free return)
The risk-free return is the baseline we introduced using the bank-interest analogy. It isn't the CSI 300's return. Setting it to 0% in the example gives:
0% + 0.5 × (10% − 0%) = 5%
This relationship comes from the capital asset pricing model, or CAPM. The actual return minus its reference is commonly called Jensen's alpha. You don't need to memorize those names; they help identify this particular comparison when you look for more information.
Choosing a risk-free return in practice involves the currency and relevant time horizon. You can't simply pick any deposit rate and plug it in. The bank example helps explain the idea; it doesn't prescribe which deposit to use in a calculation. CFA Institute: Currency and maturity in return comparisons
Researchers commonly estimate alpha from multiple return observations over time, while allowing for random variation in each observation. An unexplained move on one day isn't all stable alpha.
Positive alpha isn't a medal either
“Got it,” said Hoppy. “So we ask AI to find positive alpha for Nine-Beat, then hand out the medal?”
Don't give AI the answer you want it to find.
A model can leave out important factors. It might account for the broad market but miss something about a particular industry. What looks like extra performance could change when we use another explanation.
The index we choose and the period we examine also affect the evaluation. Even a positive result needs further checking: is it stable, or could it be chance?
Alpha isn't “pure skill” automatically extracted from the returns. A model makes the explanation more specific, but observing a relationship doesn't prove that a trading rule caused those returns.
Beating an index is a comparison result. To explain it, ask: compared with what? Which factors were considered? What remains unknown?
For our account, we can keep the original conclusion: it outperformed the CSI 300 over the same period. But we haven't performed the model-based evaluation discussed here, and we don't have evidence to give Nine-Beat all the credit.
“Put the medal away for now,” said Hoppy. “There's more we could investigate.”
Curious? Here's somewhere to start
In Codex or WorkBuddy, you can ask AI to look at the existing account records and discuss which explanations would be worth checking.
You don't have to start with “calculate alpha for me,” much less ask it to prove the strategy is impressive. Try something more specific:
Discuss account attribution with AI
My account held cash for part of the period. I'd like to understand how that might affect its comparison with a market index. Use the project's existing records to distinguish confirmed facts from explanations that still need testing. Ask me for records you can't find. First discuss how we could check this; don't run new experiments or change the original results.
If it proposes a model, keep asking: what does this model include, and what does it leave out?
Understand the proposal before deciding whether to run it. Learning another metric doesn't mean you have to add another file to the project.
Hoppy kept “beat the index” in his notes. He just added a question beside it: “Why?”
There was something else he wanted to look at too.
Even if two accounts finish with the same gain, could their journeys be very different? One might be relatively steady; the other might make you want to close the screen every day. The final return alone won't show that difference.
Next, we'll follow the account curves and look at what happened along the way.
Lesson discussion
Share a question, insight, or different view—and see how other learners are thinking.