Lesson 3
A Real Pattern—or a Lucky Result?
Explore uncertainty, repeated testing, and walk-forward validation by asking whether an attractive result survives another period.
Hoppy wrote “return, drawdown, Sharpe ratio” in his notebook.
“Next time I read a research report, I'll have a better idea of what to look for.”
Dr. Hop nodded. “And there's another question you can ask: would those results hold up over a different stretch of history?”
Hoppy drew a question mark beside his notes.
“So it's not just about reading the numbers. We should check whether we happened to catch a good stretch?”
Exactly. In the previous lesson, we met several measures that describe an account's experience. Now we can go a step further: when a result looks good, how can we check whether it depends too heavily on that particular experience?
Would another set of observations give a different answer?
Remember the random-date experiment? Each new round of sampling produced a slightly different average return for the comparison group. That didn't necessarily mean the program was wrong. It had drawn different dates.
Results calculated from a collection of observations deserve the same attention. Start with two small questions.
First: which observations support this result?
A good average return could come from many reasonably successful trades. Or a handful of huge winners could be doing most of the work. The average alone doesn't tell us which.
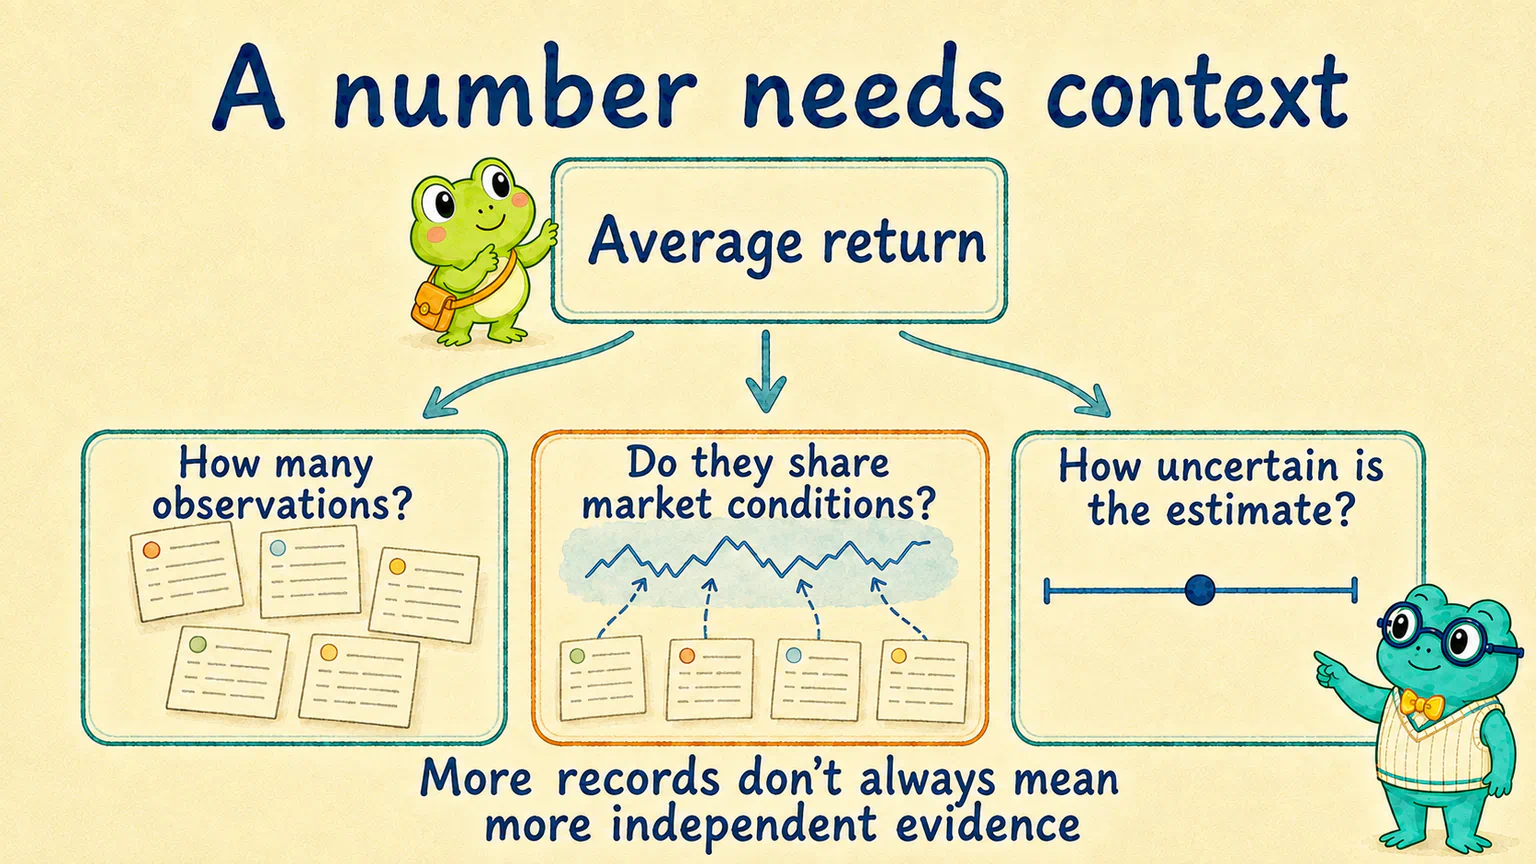
The number of observations is what we call the sample size. As well as counting rows, we need to look at what those observations experienced.
Suppose many stocks made money during the same market rally. They shared some of that experience. Hundreds of trades don't necessarily amount to hundreds of unrelated tests. Holding periods can overlap, too: a trade entered today and another entered tomorrow may live through many of the same trading days.
More relevant observations usually help. But also ask whether they're concentrated in just a few stretches of market history.
Second: how precisely can we estimate this number?
A different set of observations may give a different average. Reporting just one number can make that uncertainty easy to forget.
A confidence interval is one way to express it: alongside the estimate, we report a range calculated using a statistical method. A wide interval often means the data don't pin the value down very precisely. How we interpret that range depends on the method and assumptions used. NIST: What a confidence interval means
Think back to the random-date experiment. We weren't only interested in how much Nine-Beat returns exceeded random-date returns. We could also ask: if randomly chosen dates often produce returns this high, is our result really unusual?
That gives us an intuitive starting point for statistical significance. Suppose the rule has no advantage of the kind we're looking for. Under the random model we've specified, how often would a difference this large—or larger—occur? To judge that, we need to state the assumptions and method first, not just admire the curve.
Even a statistically significant difference may be too small to cover trading costs. It certainly doesn't guarantee future profits. American Statistical Association: Significance does not measure effect size or importance
Optional reading: confidence intervals and p-values—two common misreadings
The 95% in a “95% confidence interval” describes the method. If the relevant assumptions hold, and we repeatedly sample data and construct intervals in the same way, about 95% of those intervals will cover the true value we're estimating in the long run. It doesn't mean the next trade has a 95% chance of making money. Nor does it mean that 95% of individual trade returns fall inside the interval.
A p-value is the probability, under the specified hypothesis and model, of obtaining a result as extreme as the observed one or more extreme. It isn't “the probability that the hypothesis is true” or “the probability that these profits were just luck.” Crossing a threshold cannot replace examining the sample, the size of the difference, and the research process.
If AI gives you these numbers, ask what it is actually estimating or testing. How has it handled connections caused by shared market conditions or overlapping holding periods? A statistical label doesn't mean those issues have been taken care of.
How many results did you choose this one from?
Imagine another scene.
Hoppy keeps exploring his own rules and finally finds a version with a pleasing return and Sharpe ratio.
“This one looks good.”
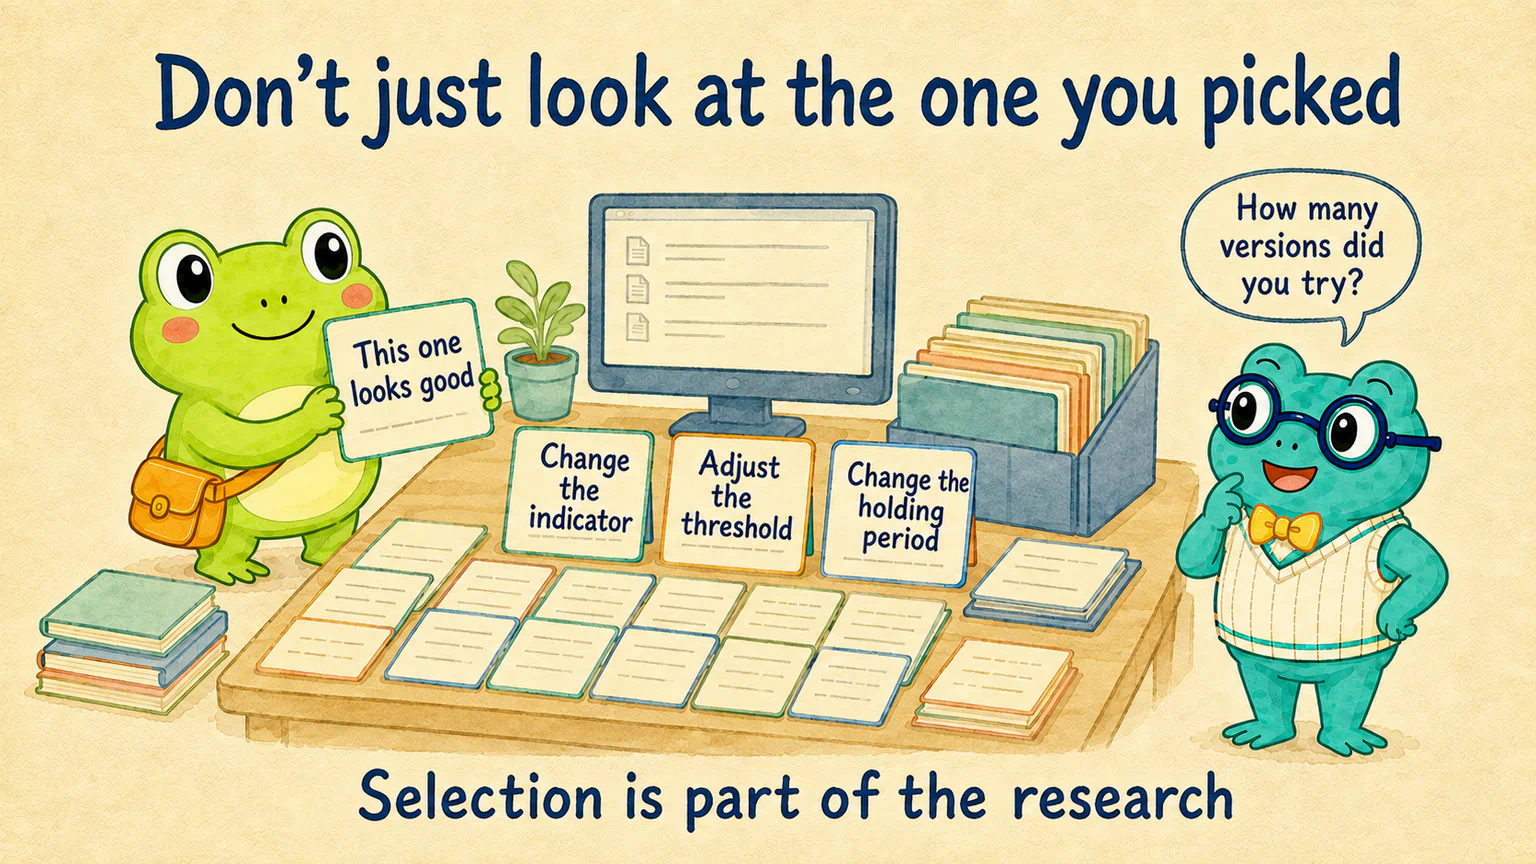
“How many versions did you try?” asks Dr. Hop.
Hoppy scrolls down through the folder.
And keeps scrolling.
Changing an indicator, moving a threshold, or trying another holding period is perfectly normal exploration. But if we try lots of versions and present only the prettiest result, we're leaving out important context: we selected it from many attempts.
Even rules with no genuine advantage can happen to fit a particular stretch of history. More attempts create more opportunities to encounter an attractive result like that. This is the multiple testing problem we need to consider when testing repeatedly. We can't treat the selected attempt as though it were the only test we ever ran. Bailey and colleagues: Repeated trials and backtest overfitting
If we keep adjusting a rule to suit old data, it may get better and better at handling the history it has already seen, without finding anything that carries over elsewhere. Treating accidental details in old data as lasting patterns is overfitting. It isn't exclusive to machine learning. Adding conditions by hand can do it, too.
“So should I stop changing things?”
No. Exploring isn't the problem. Hiding the exploration is—as if that good result had been waiting for us from the start.
You don't need a long report for every attempt. But you and your AI assistant should at least know what you tried and why you chose this version. Rejected versions are part of the research context, too. Don't keep only the winner.
Also remember that once validation data have guided a change, we can't pretend they remain unseen. We've already opened the 2023 results. If we now change a rule because of those results and test it on the same year, we're continuing to explore—not obtaining a fresh, independent validation.
Besides trying another year, what else can we check?
Start with a small change: move a condition slightly.
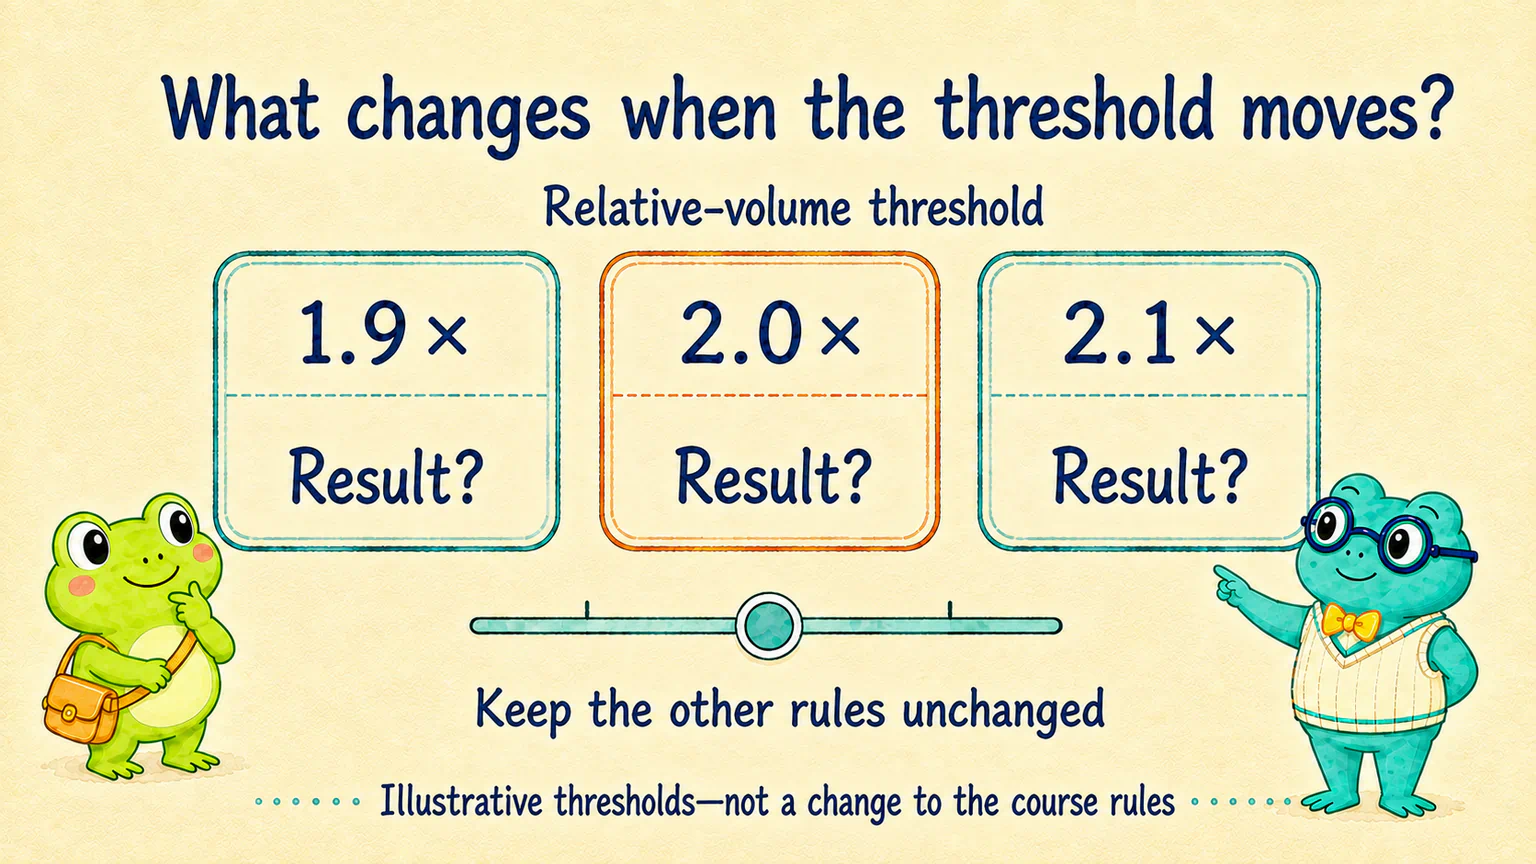
Suppose a study uses a relative-volume threshold: consider buying only when today's volume is at least twice the chosen historical average.
What about 1.9 times or 2.1 times? With the other rules unchanged, what happens at nearby thresholds?
These numbers are just an example. We're not changing the entry rule we used earlier.
If the result looks wonderful at exactly 2.0 but changes dramatically just to either side, we have another question to investigate. Why such a difference? Did the change happen to add or remove a few influential trades?
Checking how much a result changes when we adjust a number is a parameter sensitivity check.
This doesn't require every nearby version to make money. Nor does a large change automatically make a rule invalid. The point is to look beyond the single setting we like best. Whether the main judgment holds up under a reasonable change is one of the questions robustness research asks.
Another approach is to move forward through time, one stretch at a time.
Previously, we researched one period of history and then opened later data. We can extend that idea.
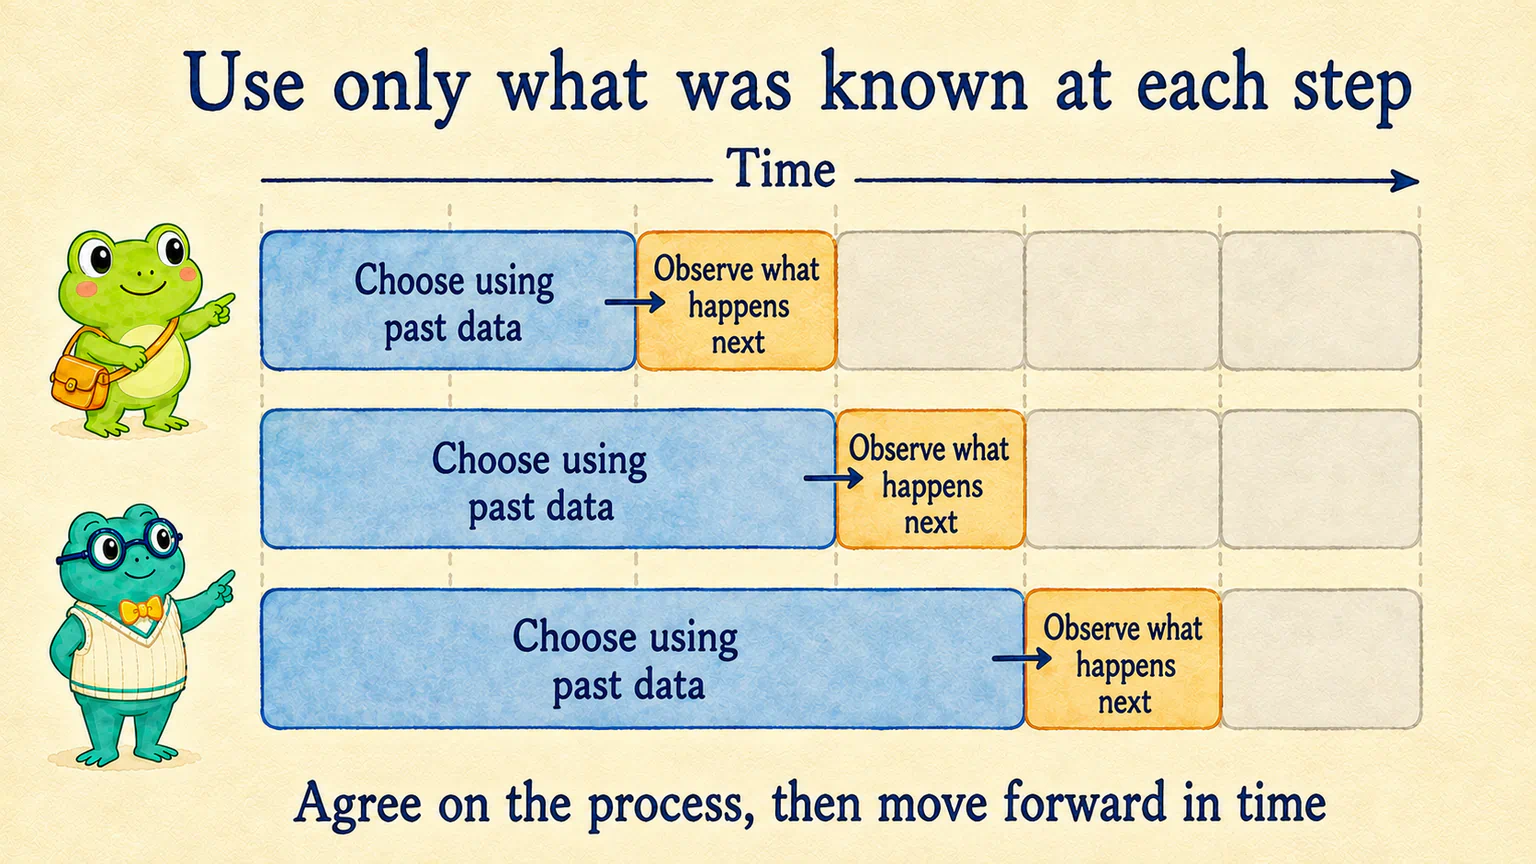
First agree on how each round will choose rules and how long each period will be. In the first round, make the choice using only observations that were fully available at that point, then examine the next stretch. In the following round, move forward, choose using what is known by then, and examine a later stretch.
This is one form of walk-forward validation. Rather than relying on a single before-and-after split, it lets us examine how the research procedure behaves as time advances. The important thing isn't the number of boxes in the diagram. It's preserving the order of events in every round. Forecasting: Principles and Practice: Validation that moves forward in time
Of course, if we inspect those periods and repeatedly change the rule-selection procedure, we're selecting that procedure as well. Calling something “validation” doesn't make it immune to overfitting.
So walk-forward validation isn't about cutting old data into ever smaller pieces. More splits don't produce more certificates of approval. They offer another way to examine the research.
Start with the concern, not a checklist
By now, Hoppy has written down a row of new terms.
“Do I have to do all of these to pass?”
There's no need to turn them into another checklist. It's more useful to start by saying what concerns you.
| What concerns me… | What I could explore next |
|---|---|
| This number depends too heavily on these particular records | The sample, uncertainty around estimates, and suitable statistical tests |
| I tried so many versions before finding a good-looking one | The selection process, multiple testing, and overfitting |
| A small threshold change undermines the main judgment | Parameter sensitivity and robustness |
| A single time split doesn't tell me enough | Validation methods that move forward through time |
These methods don't guarantee future profits. They help us make better-supported decisions about what to investigate next, which judgments to retain for now, and which claims we still can't make.
Don't just ask how good the result looks. Ask which records support it, how many attempts it was selected from, and what happens under a reasonable change.
Discuss robustness with AI
If you'd like to continue, open Codex or WorkBuddy and ask a concrete question about your existing research. For example: “I'm concerned that a few trades account for most of this result. Look at the records we already have. How could we check that?”
Ask AI to separate observed facts from explanations that haven't been tested. Discuss a suitable approach before deciding whether to run it. You don't need to add every test at once—or casually change the original results to carry out a check.
Hoppy adds another question to his notebook: “Does this result depend too much on a few particular market periods?”
That's already a step beyond admiring one attractive number.
But even if the historical evidence becomes more reliable, there's another practical question. When a program assumes a trade can be bought and sold, would that trade actually be possible with real money?
That's where we'll pick up next.
Lesson discussion
Share a question, insight, or different view—and see how other learners are thinking.