Lesson 3
If the Price Is on a Website, Why Can't My Program Get It?
Separate prices shown on a webpage from research-ready data, including sources, permissions, adjustments, and the course dataset.
Once the little game was running, Hoppy decided the lab was officially open for business.
He found a stock on a market website, then turned back to AI.
“The website already shows the daily price. Bring it into the project and let’s start researching.”
AI did not start immediately.
“Which dates do you need? Just the closing price, or the open, high, low, and volume too? Should the prices be adjusted? Does this website allow a program to retrieve the data repeatedly?”
Hoppy looked at the website, then at AI.
“I only asked for a stock price. Where did all those questions come from?”
Dr. Hop turned the screen toward him.
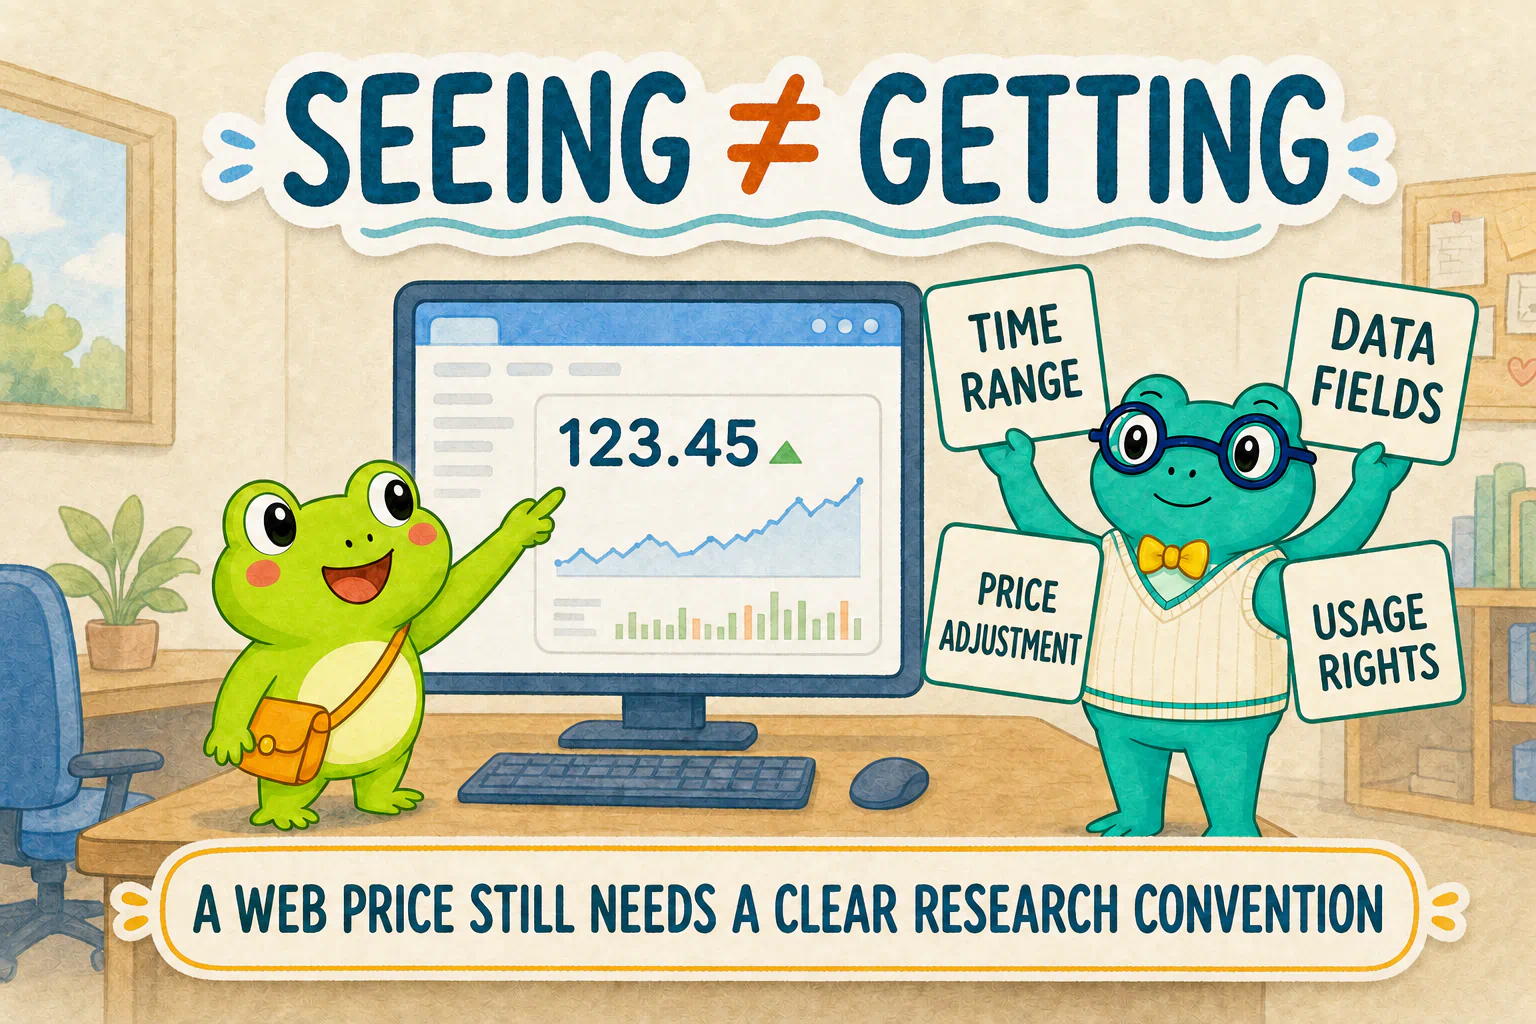
“Because what you see is a number presented for a person to read. Quantitative research needs data that a program can retrieve repeatedly, whose definitions are clear, and that we are allowed to use this way.”
Seeing a price on a website does not mean a program can retrieve it reliably.
Retrieving it once does not mean the data is ready for research.
In this lesson, we will find the doors that lead into market data.
Let the little game clock out first
The game has finished its job.
It helped us confirm that AI could create files in this lab, prepare a Python environment, install a dependency, and run a program. We are about to work with actual market data, so our frog no longer needs to stay on bubble duty.
In the old conversation, ask AI to clear the workbench:
Give this to your AI research assistant
The little game has completed its environment-test job, so I no longer need it.
Inspect the current project first. List the code, generated files, and dependencies that belong only to the game, and explain what you propose to remove and keep. Keep uv, Python, the project’s .venv, and any project configuration that will still be useful for data research. Do not touch anything outside this lab.
Do not delete anything yet. Stop after presenting the list and wait for my confirmation.
After you understand the list and agree with its scope, continue with:
I confirm this cleanup list. Carry out the deletion, then tell me exactly what you removed, what you kept, and whether the project can still run Python.
After AI finishes cleaning, open a new conversation inside the same lab project.
The old conversation is not broken. It is simply full of game rules, window errors, and bubble colors. A new conversation gives the market-data task a cleaner context.
Start by checking that the new conversation is still standing in the same lab:
We are starting the market-data part now. First confirm the current project root and explain in plain language what remains after the cleanup. Do not create, modify, or install anything yet.
If it sees a different folder, switch back to the correct local lab before continuing.
Do not carry the entire market home today
Market data can record every individual trade and can update many times per second.
That detail can be valuable, but it also brings larger files, more API requests, more complicated trading-hour rules, and higher data costs. We do not need to solve all of those problems yet.
This course begins with one day as its smallest time unit.
We will mainly use:
- daily data for individual stocks;
- daily data for broad-market and industry indices;
- a small amount of company reference data needed to understand those records.
A typical daily record roughly tells us:
which day this is
→ the opening price
→ the highest and lowest prices during the day
→ the closing price
→ how much was traded
That is enough for the later lessons to draw candlesticks, define conditions, test hypotheses, and run daily-frequency backtests.
It cannot tell us what happened during a particular minute, and it is not suitable for high-frequency research. That is not a flaw. It is a deliberate boundary for this course.
Faster and larger data is not automatically more professional.
Getting data that actually fits today’s question matters more than hauling home the whole market.
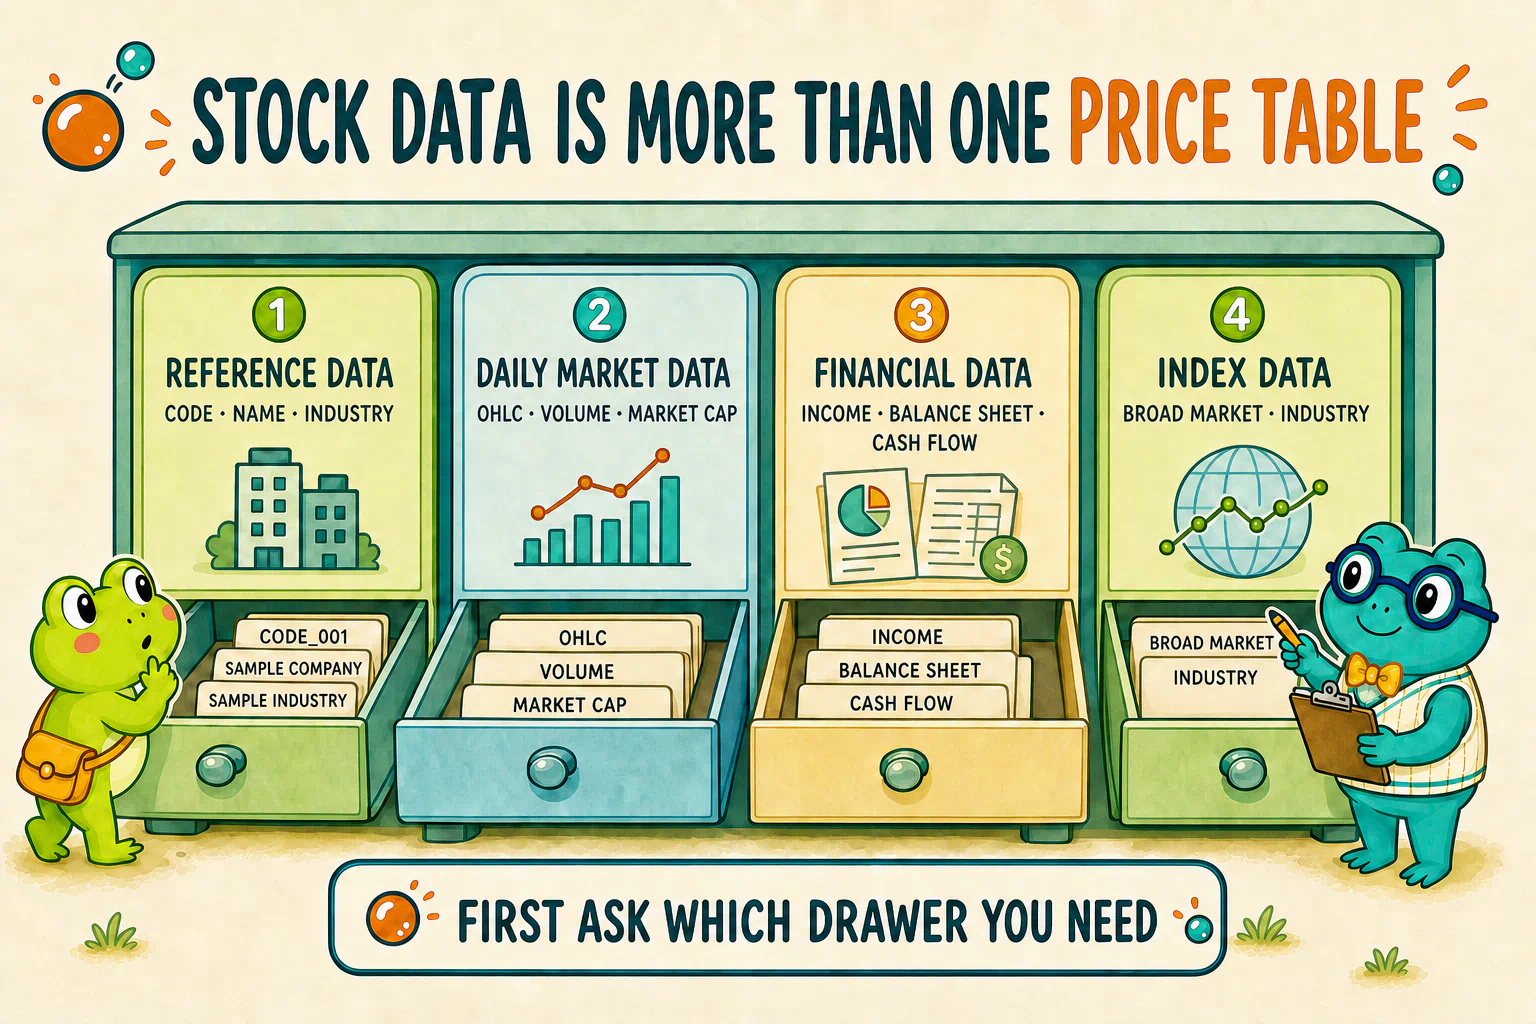
“Stock data” is stored in several different drawers
Hoppy assumed stock data meant one very long table of prices.
Once he opened a data service, it looked more like a filing cabinet. Each drawer held something different.
To keep a pile of fields from blending together, let’s sort common market data into four groups.
Drawer one: who is this stock?
This data is like a stock’s identity card. It commonly includes:
- ticker or security code;
- company name;
- market and exchange;
- industry;
- listing date;
- whether the security is still actively traded.
It is often called reference data, basic data, or security master data.
When a price table contains only codes, this drawer tells us what each code represents. Later, when we expand to many stocks, it also helps us group companies by industry or exclude securities that no longer fit the research universe.
Drawer two: what did the market record today?
This group can include:
- open, high, low, and close;
- trading volume and trading value;
- daily market capitalization;
- daily valuation measures such as price-to-earnings and price-to-book ratios;
- trading states such as a suspension or a daily price limit.
We will call these daily market data.
Other materials may call parts of this group quote data, technical data, or daily indicators. You do not need to memorize the label. First ask whether a field records a price, trading activity, or a measure calculated from that day’s data.
Drawer three: the company’s periodic report card
A company does not publish a complete financial report every day. Income statements, balance sheets, and cash-flow statements are normally released quarterly, semiannually, or annually.
These are financial data.
Their timing differs from daily prices. A report may describe a quarter, but that does not mean investors knew its contents on every day of that quarter. When we eventually use financial data, we must also care about when it became public.
For now, we only need to recognize this drawer. We do not need to carry a full set of financial statements into the lab today.
Drawer four: what should we compare a stock with?
A stock can rise and still fail to beat the market.
If the broad market rose even more over the same period, that stock may actually have lagged. We therefore need index data—daily records for broad-market and industry indices—to give our research a ruler.
An index helps us see roughly where the market or an industry went. It is not an ordinary company stock, so it should not be mixed into the same table without being clearly identified.
There is no single answer to “Where does data come from?”
Different markets have different data channels. Even within one platform, APIs, permissions, and prices can change.
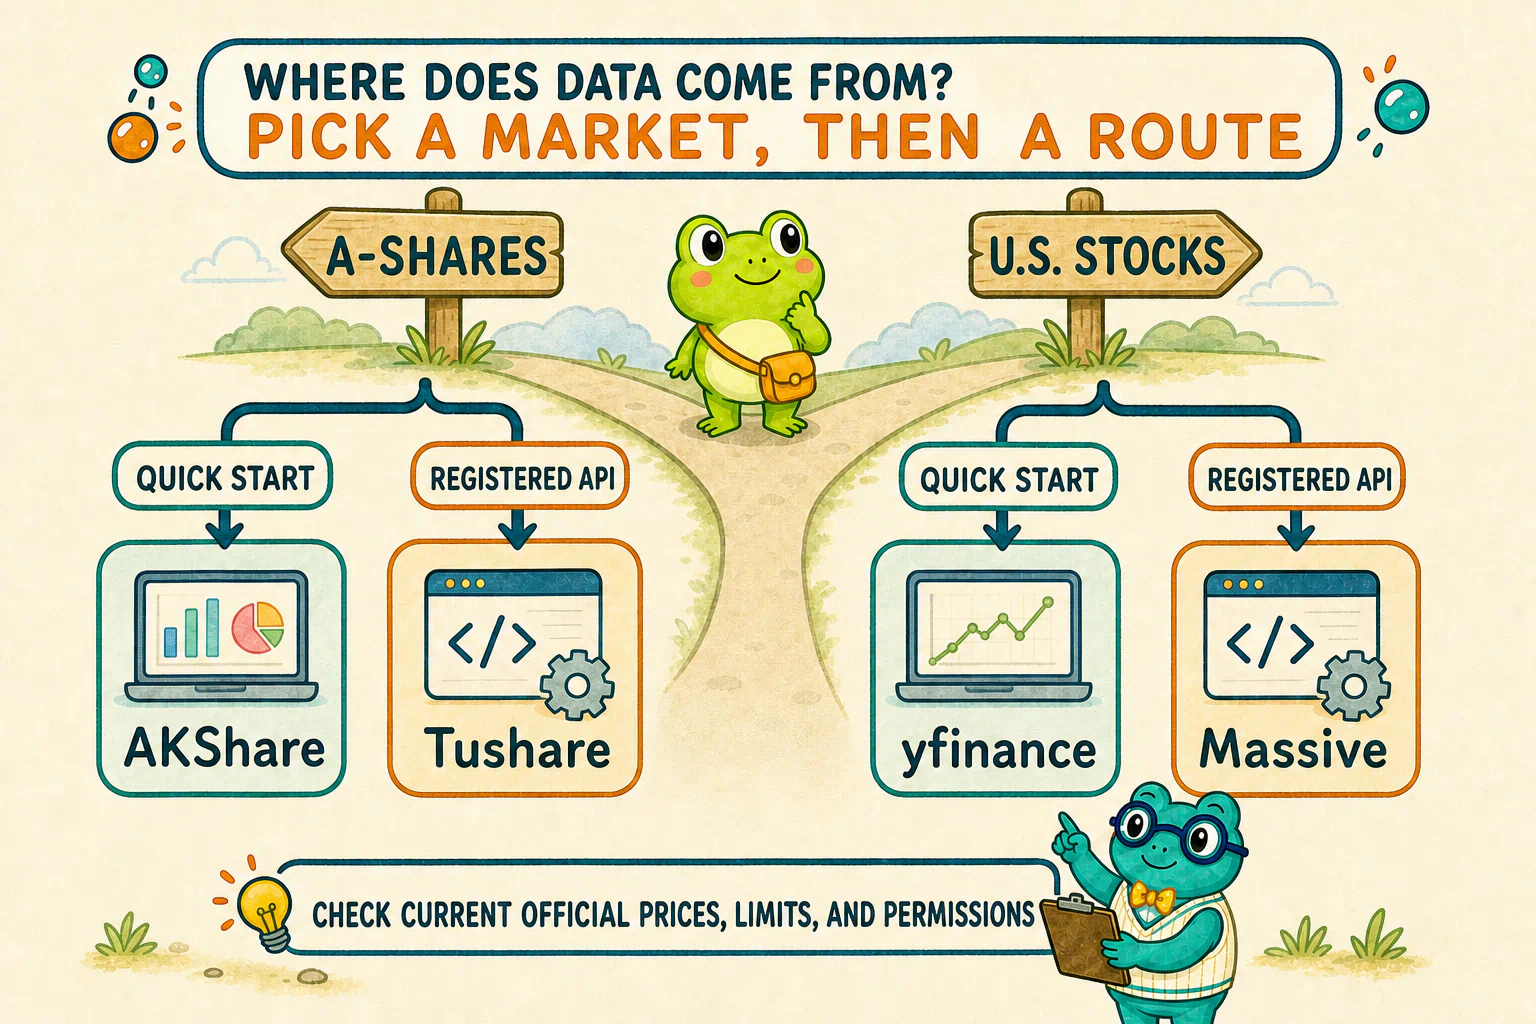
This course uses China’s A-share market for its main examples while also introducing common choices for U.S. stocks. Market rules differ around the world, but the basic questions in this lesson—coverage, fields, timing, adjustments, permissions, and reproducibility—travel well across markets.
The names below are starting points for investigation, not a permanent ranking.
Common starting points for A-shares
AKShare is an open-source Python data-interface library. It organizes many public data entrances into interfaces that Python can call, making it useful for quick experiments and learning. It is not a stock exchange. When an upstream page or interface changes, some AKShare functions may change too.
Tushare is a data service that requires registration. Its interfaces cover reference data, daily prices, adjustment factors, daily measures, financials, and index data. Permissions, points, and plan requirements should always be checked against the current official documentation.
Common starting points for U.S. stocks
yfinance is a community-maintained Python tool that can retrieve historical prices and other information from Yahoo Finance. It has a low barrier for quick experiments, but it is not a formal exchange data service. Check the current documentation and the source’s usage rules before relying on it.
Massive, formerly Polygon.io, is a formal market-data API service focused on the United States. It normally requires an account and an API key. Different data, history, and request capabilities may belong to different plans.
These links were checked on August 31, 2026.
We deliberately do not copy a table of free request limits, years of history, or plan contents into this lesson. Those details change easily, and learners have different markets, uses, and budgets.
The transferable skill is asking AI to investigate the current official material with you.
Replace the placeholder below with a platform you are considering:
Give this to your AI research assistant
I am considering [platform name] as a source of stock data for personal quantitative learning, not for live trading.
Read the platform’s current official website, official documentation, and data-licensing information. Do not answer from memory alone. Help me confirm:
- which markets and security types it mainly supports;
- whether it provides daily stock prices, security reference data, financial data, and daily index data;
- how much history is available and how often the data updates;
- whether prices are adjusted and what the default convention is;
- whether registration, an API key, points, or a paid plan is required;
- the current request limits and major restrictions;
- whether personal research is allowed and whether redistribution is allowed;
- how Python normally connects to it.
Date your answer and attach official links to the key claims. If the official material is unclear, label the point “confirm with the provider” instead of filling in the gap yourself.
Investigate only for now. Do not install packages, write integration code, or register an account for me.
You do not need to investigate all four choices.
First decide whether you are studying A-shares or U.S. stocks. Comparing one or two routes within that market is usually enough for a first decision.
Ask “Does it fit?” before asking only “Is it free?”
Free is useful.
But a free interface can still limit request volume, historical range, update speed, and permitted use. Being technically able to call an interface does not automatically give us permission to repackage and publish its data.
Before choosing your first route, ask AI to check these questions with you:
- Does it cover the right market? Does it include the market, stocks, and indices you want?
- Is the history long enough? Does it cover the period required by your research?
- Are the fields sufficient? Does it provide what you actually need, rather than merely a large field count?
- Are the definitions clear? Are prices adjusted? How are market capitalization and valuation measures defined?
- Can you retrieve it again? Is the API, SDK, or download route suitable for a program that must run more than once?
- Can you accept the access requirements? Do the registration, limits, cost, and network conditions fit you?
- Are you allowed to use it this way? Personal research, public display, and redistribution can have different boundaries.
No platform will remain best at everything forever.
AKShare or yfinance may get a first experiment moving quickly. Registered APIs such as Tushare or Massive let us practice accounts, keys, and a formal interface. Base your decision on the facts you can verify today.
Registration and keys are work you must complete yourself
If your chosen platform requires an account, you must register, read its terms, and decide whether to accept a paid plan yourself.
AI can help you find the official entrance and explain the requirements. It cannot accept an agreement or buy a service for you, and it should not ask for your password or API key.
Think of an API key as the key a program uses to enter a data service.
Once you receive it, do not hard-code it into the lesson’s code or paste it into a public conversation, screenshot, or Git repository. A safer route is to let AI prepare a local configuration method and an example file with no real value, then type the key yourself into a secure location that stays on your machine.
You can split the conversation into two handoffs.
First, ask AI only to show you the way:
Give this to your AI research assistant
I have decided to try [platform name].
Using the current official tutorial, tell me which registration, permission, or API-key creation steps I must complete myself. Use only official entrances and explain which choices may involve fees or data-licensing terms.
Do not fill in forms or create code yet. Stop after the instructions and wait for me to return. Do not ask me to send my password or API key in this conversation.
After registration, ask it to prepare the connection:
Give this to your AI research assistant
I have registered with [platform name] and I now have the API key in my possession.
Inspect the current project and .gitignore first. Do not overwrite or delete unrelated work. Using the current official documentation, design the smallest safe local configuration for this project:
- do not place the real key in source code, public documentation, or version control;
- tell me where I should type it myself and which variable name the program will read;
- provide an example configuration containing no real key;
- before making a request, explain in plain language what you will create or modify.
Stop once the setup is ready for my manual input. Do not read, print, or repeat the real key.
Different AI tools may use different safe configuration methods. Everyone’s filenames do not have to match.
The boundary that matters is simple: the key stays in an appropriate local place, the program refers to it by a variable name, and the real value never appears in public material.
If you truly cannot edit the configuration file, you could give the API key to AI and ask it to write the value for you.
This is not safe, and it is not the route we recommend. The real key may appear in conversation history, operation logs, or another place you did not notice. Never send it to a public chat tool or post it in a course discussion.
The right approach is to ask AI to teach you how to do the manual step:
“I do not know how to edit this configuration file. Tell me which application can open it, exactly where I should edit, and what the format should look like. Show an example using a fake key. Do not read or enter the real key. Wait for me to finish manually before continuing.”
It may take one extra minute, but the key stays in your own hands.
Take one small sip of data for the first connection
Once the key is ready, do not immediately download hundreds of stocks and many years of history.
The first request needs to answer only one question: can this project use the chosen route to retrieve a small, well-structured sample of daily data?
Choose one stock for practice and a short date range:
Give this to your AI research assistant
Using the current official documentation for [platform name], run one minimal connection test.
Retrieve only a short daily history for one practice stock. Do not download the full market or begin analyzing price patterns. The request should include at least date, open, high, low, close, and volume. If the platform returns more fields, preserve the raw response first and explain those fields.
Use this project’s environment and secure configuration. Do not print the API key. Run the request for real, then tell me:
- whether it succeeded;
- how many rows came back;
- the returned date range;
- which fields are present;
- the exact endpoint used;
- the current price-adjustment convention.
If it fails, keep the real error and first classify it as a local-code, network, authentication, permission, quota, parameter, or provider-side problem. Work on one main cause at a time. Do not bypass authentication, quotas, or provider restrictions.
Some routes do not require an API key. AI can skip the key setup when that is true.
If the route requires a Python package, keep using the project environment from the previous lesson. Do not casually install it into the computer’s shared Python environment.
The first success has a deliberately small definition: the real request returned something, the program could read it, and the fields and date range can be explained.
It still does not prove that the data is ready for a backtest.
Once data arrives, ask: has this price been adjusted?
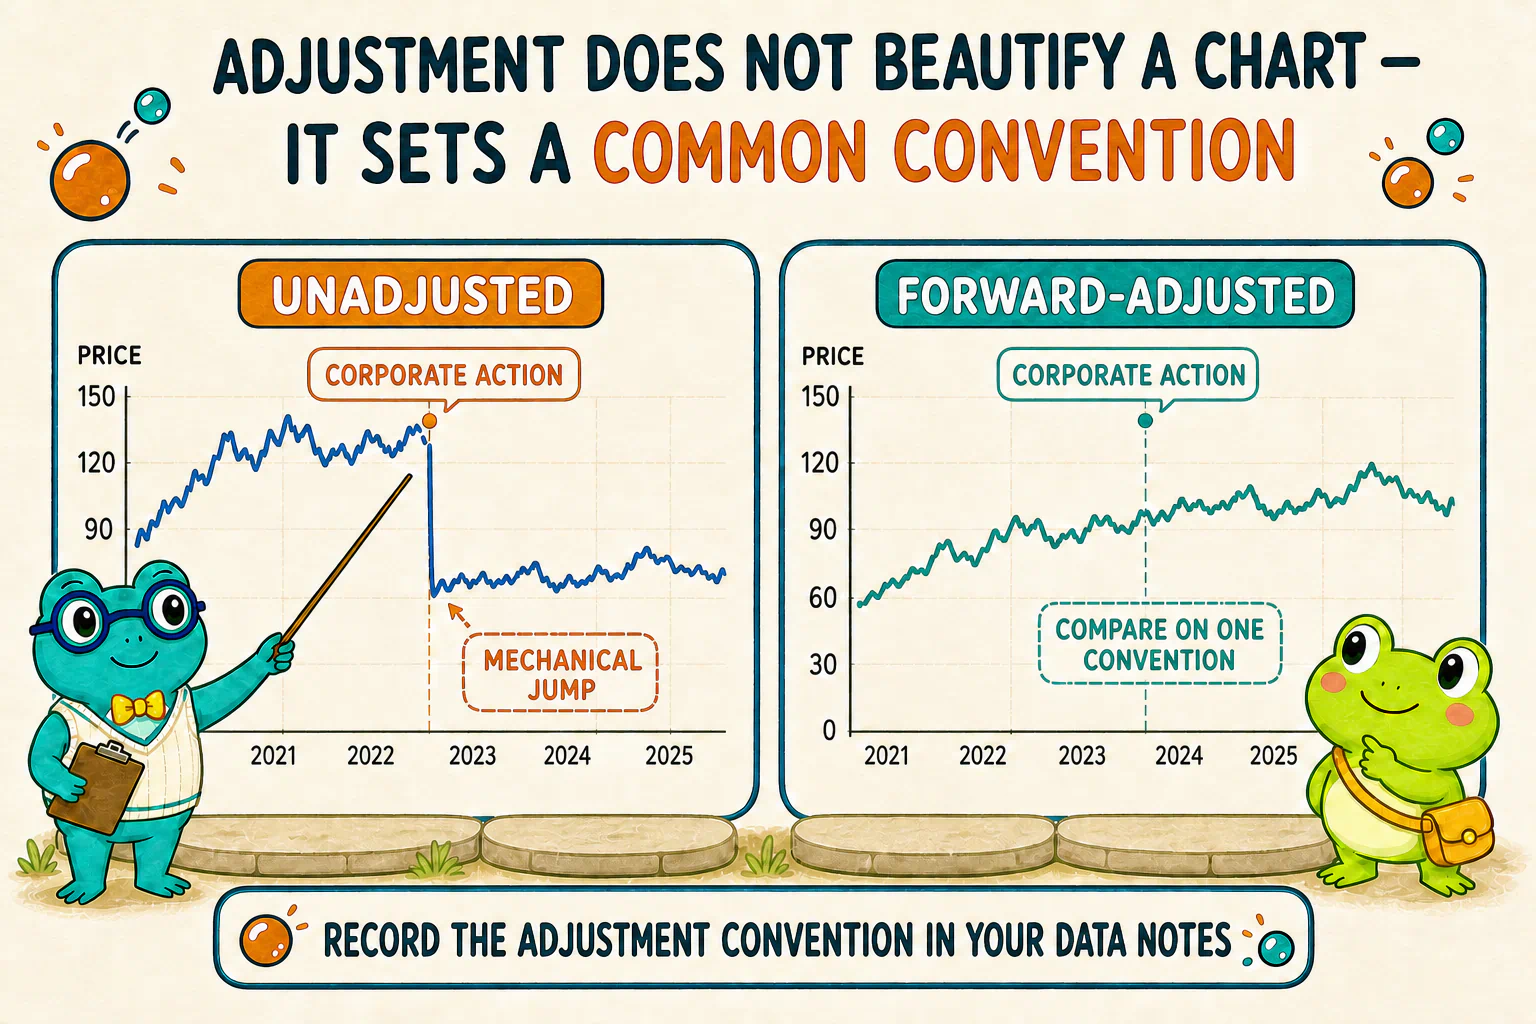
Suppose a stock closed at 100 yesterday. Today, a split or another corporate action changes both the number of shares held and the quoted price per share.
If we connect the two prices directly, the chart may show a dramatic jump. That jump does not necessarily mean the business suddenly deteriorated. It may come from a change in how each share is quoted.
To make prices across dates more comparable, a data provider may adjust historical prices for splits, dividends, bonus shares, rights issues, or other corporate actions. In China’s A-share context, this family of operations is commonly discussed as price adjustment or fuquan (复权).
In plain language:
- unadjusted prices stay closer to the quotations that actually appeared on each historical date;
- adjusted prices transform the historical series under a stated rule so that prices around corporate actions are easier to compare;
- A-share materials often distinguish forward adjustment (前复权), backward adjustment (后复权), and adjustment factors;
- markets and providers can differ in what they adjust, their defaults, and their calculation methods.
The biggest danger is not forgetting a formula. It is seeing a column named close and assuming it must use the convention you want.
Ask AI to investigate the real data you just retrieved:
Check this with your AI research assistant
Using the endpoint we actually called and its current official documentation, check the price convention in this daily dataset.
Tell me whether the default is unadjusted, forward-adjusted, backward-adjusted, or another provider-defined method. Explain whether it accounts for splits, dividends, or other corporate actions. Cite the official explanation instead of guessing from a column name.
If the endpoint supports multiple conventions, state which one our request actually used. Write the conclusion into a short data note, but do not transform the data or begin a backtest yet.
“The provider adjusts it automatically” is not yet a complete answer.
AI needs to say who performed the adjustment, what convention was used, and where that claim comes from. If the official documentation is unclear, record the ambiguity as an unresolved question.
Keep the external route, and prepare the course data too
Registration, network access, quotas, and platform changes can temporarily block a real data connection.
That should not block the whole course.
Even if your external connection works, complete the next step as well. The following lesson uses the Hoppy teaching data as a shared starting point, so differences in provider fields, adjustment methods, and response formats do not turn the first chart into an API troubleshooting marathon. Keep your external route in the project and improve it gradually later.
We provide a downloadable Hoppy teaching dataset. Every company code and company name is fictional and has no relationship to a real company. The package exists only for programming, data analysis, and quantitative-research education. It is not investment advice and must not be used as the basis for an investment or trade.
To make later candlestick charts and course experiments easier, the open, high, low, close, and previous-close fields in stock_daily.parquet use a forward-adjusted A-share convention. Their names begin with adjusted_.
If you use your own data source, do not assume its prices are already adjusted. Give AI the provider documentation, the real field names, and a small sample. Confirm whether the data is unadjusted, forward-adjusted, or uses another convention. If a transformation is needed, ask AI to follow the provider’s official adjustment factors or method and record the chosen convention. Do not mix unadjusted and adjusted prices inside one experiment.
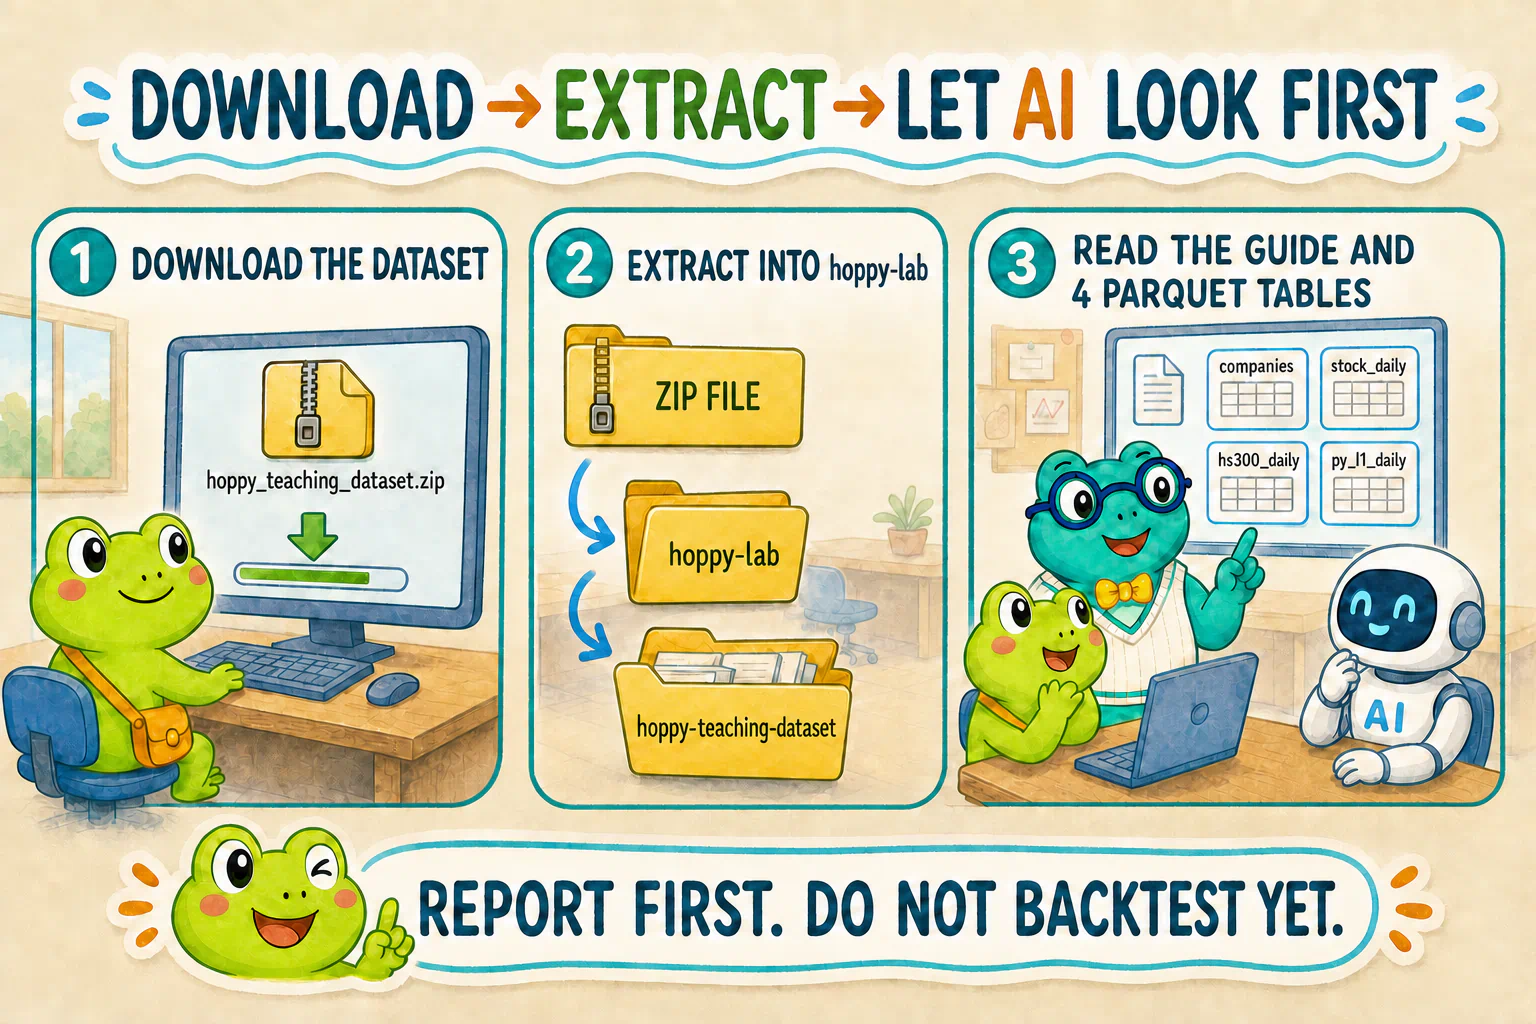
Download the Hoppy teaching dataset
After downloading the ZIP file, place it in the root of your hoppy-lab folder and extract it there. The lab should now contain a folder named hoppy-teaching-dataset:
hoppy-lab/
├── hoppy-teaching-dataset.zip
└── hoppy-teaching-dataset/
    ├── README.md
    ├── manifest.json
    ├── data_dictionary.json
    ├── companies.parquet
    ├── stock_daily.parquet
    ├── hs300_daily.parquet
    └── py_l1_daily.parquet
The package covers January 4, 2021 through December 29, 2023: 727 teaching trading days. It contains 300 fictional companies assigned to 11 teaching industries, with 12 to 41 companies in each industry.
| Table | Rows | Main grain |
|---|---|---|
companies | 300 | one row per fictional company |
stock_daily | 216,913 | company × trading day |
hs300_daily | 727 | broad market × trading day |
py_l1_daily | 7,997 | 11 industries × 727 trading days |
The tables use the Parquet format. A normal text editor cannot open them directly, which gives us a useful exercise: hand an unfamiliar data package to AI, let it read the documentation and inspect the environment, then ask it to explain what is actually inside.
Return to the new conversation and say:
Give this to your AI research assistant
I extracted hoppy-teaching-dataset into the root of the current project.
Read its README.md, manifest.json, and data_dictionary.json first. Then check whether the current project already has the Python dependency needed to read Parquet files. If not, use uv to install only the minimum dependency required for this inspection into the current project environment, not the computer’s shared Python.
Actually read all four Parquet tables. Report in plain language what each table is for, its row count, major fields, date range, and the number of companies and industries in the package. Also confirm which fields in stock_daily.parquet contain forward-adjusted prices. Compare the real results with the documentation and point out any mismatch. Do not analyze return patterns or start a backtest yet.
AI may choose Polars, PyArrow, or another suitable reader. Everyone’s code does not have to match. It does need to open the real files and report from the actual result.
If the external route is still blocked but the course data works, record the current state honestly:
External data connection: unresolved
Course sample read: successful
Can I continue learning now? yes
This keeps a temporary blockage from becoming a dead end without pretending the external problem disappeared.
If the external route also works, record the two routes separately. The next lesson will still use the course data first. Your successful external connection was not wasted: it taught you how to investigate a provider, configure an interface, and confirm a price-adjustment convention.
Finally, ask AI to explain the data route you now have
Whether or not the external route worked, ask AI for a short review of the two routes now present in the project:
Check it with your AI research assistant
Based on the current project, the real request result, and the official material we checked, summarize in plain language:
- if I tried an external data route, its current status and why it may fit my market and daily-frequency learning goal;
- what it can provide and what is clearly missing or restricted;
- whether it needs an API key and how this project avoids exposing the real value;
- whether the minimal request actually succeeded and what came back;
- the current price-adjustment convention and the evidence for it;
- whether the shared course dataset was successfully extracted and read, and what it can and cannot be used for;
- what still needs to happen before I can select, check, and draw one virtual stock from the course data.
Do not grade me. Do not claim the data is correct or the research is complete merely because the program ran. List any remaining uncertainty as an open question.
By now, we should be able to separate three different claims:
I can see a price on a website
≠ a program can retrieve it reliably
≠ the data is ready for quantitative research
We have found an entrance to external data and placed the shared teaching data inside the lab.
Next, we will choose one virtual company from the teaching data, check it for obvious problems, and turn it into our first candlestick chart.
Lesson discussion
Share a question, insight, or different view—and see how other learners are thinking.